Greater Toronto, Ontario, July 4, 2024 - Jennifer Pearce, President of the Toronto Regional Real Estate Board [TRREB] this morning released the Board’s Residential MLS® Market Statistics for June, 2024 via the Board’s monthly MarketWatch report indicating - as the report suggests - most buyers are not swayed much by the Bank of Canada’s quarter point cut of the BoC rate. That was the first cut since March of 2020.
In the context of the run-up in home prices over recent years, 25 basis points doesn’t go very far in terms of purchasing power… particularly with average home prices still running well north of one million dollars.
Another point the report makes - finally letting go of the “home supply crisis” theme [as proposed to a home price / affordability crisis]: “The market remained well-supplied…”. Given the significant easing in inventory and interest rates remaining higher than many pundits expected at this point, the shake-out may well come in the form of continued softening of that average price stat.
Obviously there’s lots of turmoil around and some suggest that if “45” is successful in also becoming “47” - meaning Mr. Trump as the 45th and, potentially, the 47th - President of the United States of America and moves forward with protectionist policies, that could translate to rising interest rates. Perhaps as much as two percent higher. Yikes.
Overall…
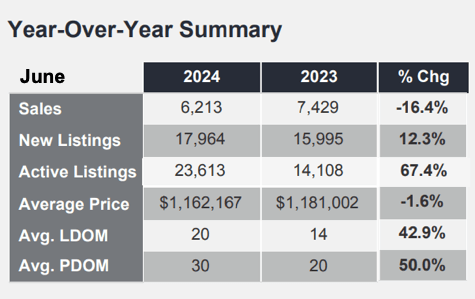
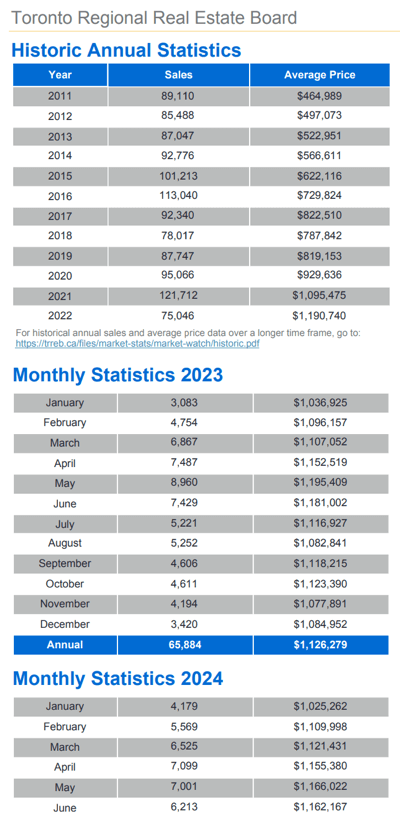
 Looking at the figures for all of TRREB’s market area and all Types & Styles of homes, 6,213 sales were reported in June representing a 16.4% drop from last June. Interestingly, last June we titled our blog post “Inventory still “snug”” and sales volume totaled 7,481 homes which we referred to as a “healthy 16% increase” over June of 2022’s 6,422 [adjusted] sales. Fast forward to last month and we’ve dropped back below that two-year-ago sales volume total.
Average selling price this June came in at $1,162,167, off 1.6%... but holding above June, 2022’s $1,146,254 average.
Interestingly, there are still a significant number of multiple offer situations - a.k.a. “bidding wars” - for well-priced properties in demand areas and / or of demand “Style”. Bungalows for sale in our market - and most others for that matter - continue to be a hot commodity in particular as Matures / Boomers / Empty-Nesters… and others… seek the single storey lifestyle and many - largely because of gardens, back yards, decks, grandchildren, and so on - aren’t yet willing to forego their “dirt” for a concrete balcony.
Due to the general seasonality of the residential real estate market, all figures quoted here are year-over-year comparisons unless specifically noted otherwise.
Specific Numbers…
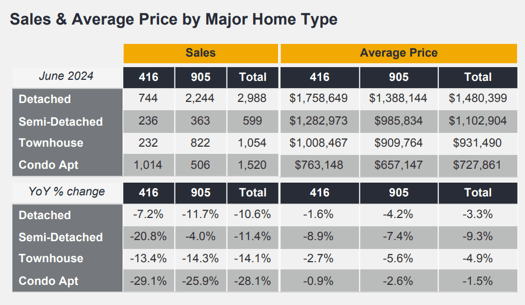
In Metropolitan “T.O.” - local lingo for “Toronto” - Realtors® reported 744 Detached homes sold on the month, off 7.2%, averaging a sell price of $1,758,649, down 1.6%. In the balance of the market area - The GTA plus some Regions on the immediate periphery thereof - 2,244 Detached homes were reported sold, down 11.7%, averaging $1,388,144, a 4.2% “trim”.
Condo apartment sales really took it on the chin: 1,014 units sold in “The 416” [area code], a 29.1% hit. The average selling price was $763,148, holding relatively steady… for now… at -0.9%. “The 905” [area code - generally speaking] saw 506 units sell, down 25.9%, at an average of $657,147, off 2.6%.
Quoting…
From the Report:
TRREB Chief Market Analyst Jason Mercer:
“The GTA housing market is currently well-supplied. Recent home buyers have benefitted from substantial choice and therefore negotiating power on price. Moving forward, as sales pick up alongside lower borrowing costs, elevated inventory levels will help mitigate against a quick run-up in selling prices.”
TRREB CEO John DiMichele:
“Despite a temporary dip in home sales due to high interest rates, we know that strong population growth is driving long-term demand for ownership and rental housing. Ontario has set the goal of 1.5 million more homes on the ground by 2031. This is only possible if all levels of government ensure actionable solutions with sustained effort, including continuing to remove red tape, avoiding financial barriers to home construction, and minimizing housing taxes and development charges.”
TRREB President Jennifer Pearce:
“The Bank of Canada’s rate cut last month provided some initial relief for homeowners and home buyers. However, the June sales result suggests that most home buyers will require multiple rate cuts before they move off the sidelines. This follows Ipsos polling for TRREB, which suggested that cumulative rate cuts of 100 basis points or more are required to boost home sales by any significant amount.”
On the Inventory Front
Gulp. “Well-supplied”, huh? We’re fans of the “Total Active Listings” [TAL] figure because it includes everything on the market in our area. The “New Listings” figure not only includes just the “newly listed” properties; it also includes all the residential listings that were “terminated” and then re-listed… often with as price reduction [or “price improvement” as some are referring to that scenario these days].
The former - “TAL” - came in at 23,613. That’s a spike of 67.4 homes available for sale as of month-end versus twelve months earlier. “Forward Inventory” - a snapshot of how much inventory we have in the context of sales volume, calculated by simply dividing TAL by the month’s total Sales - gives us 3.8 months of “supply”. Assuming sales volume remains constant. Hmmm.... That inventory “indicator” is far more in line with historical standards, by the way. A little high, but “-ish”. What’s more of a concern on that front is how quickly we’ve gone from “crisis tight inventory” to over-supplied… albeit slightly, in our opinion.
“Absorption Rate” gives us an idea of how fast the home market’s “absorbing” inventory based on the “newly listed” figure [and, for that reason, we find it less relevant]. It’s arrived at by dividing Sales Volume by New Listings. That came in at .346 for June, down from .47 last June… meaning, obviously, we’re not “absorbing” that “new” inventory as quickly as we were a year ago. No surprise there.
Also not surprisingly, homes took “42.9% longer” to sell on the month: 20 Days on the Market [DoM] on average compared to 14 a year earlier. Also from an historical perspective, that’s actually relatively quick. The long-term average is more in the 40-60 day range depending on other market conditions. Or maybe it’s the buyers and sellers that have been “conditioned”...!
What may be most difficult of all to believe is that it’s been over four years since “The Bug”... COVID19… came on the scene. Ahhh… the passage of time. #Enjoy… ☀️😎🌻🍉⛱️🤿🌱 Thank-you for checking in…
Andrew.
Questions? Comments? ...We'd ❤️ to hear from you: Drop us a line here!...
Set Up Your Own Customized SmartSearch
What's your property worth today?
Browse GTA Bungalows by City / Region
Durham Region | Halton Region | Peel Region | Simcoe County |
Toronto by Boroughs | Toronto by Neighbourhoods | York Region
Browse "Beyond the GTA" Bungalows by City / Region
Brant & Brantford Township | Dufferin County | Grey County | Guelph & Wellington County | Haldimand County | Haliburton County | Hamilton [City] | Hastings County | Kawartha Lakes | Kitchener-Waterloo & Cambridge | Muskoka District | Niagara Region | Northumberland County | Parry Sound District | Peterborough City & County | Prince Edward County

