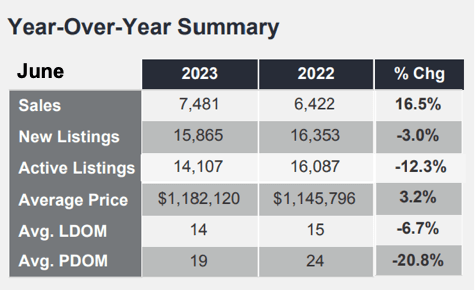
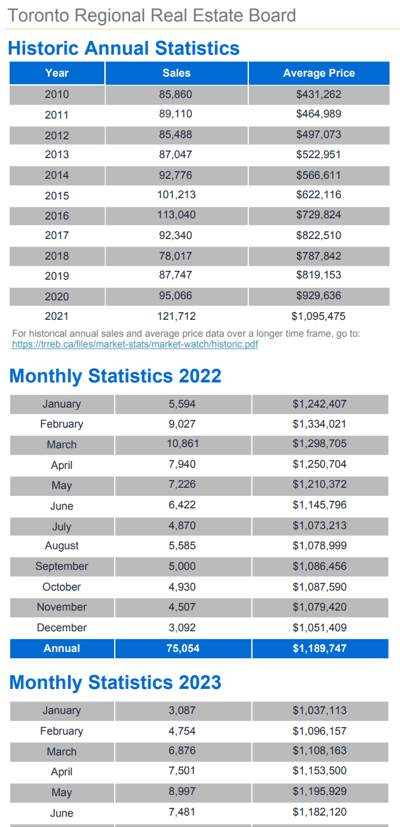
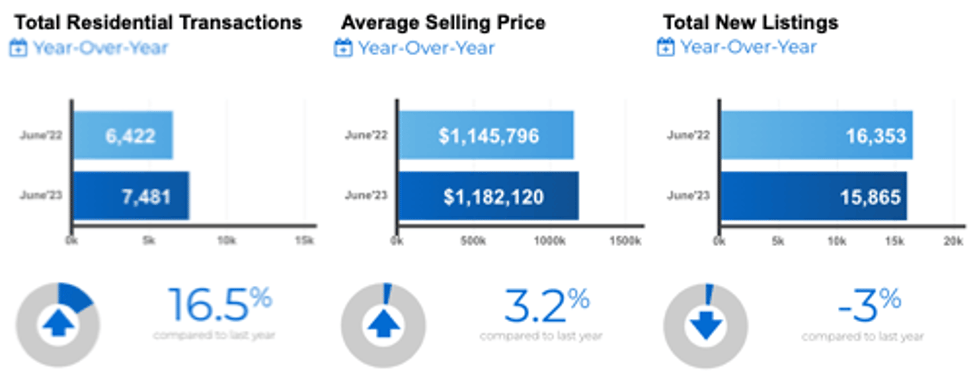
Greater Toronto, Ontario, July 6, 2023 - The Toronto Regional Real Estate Board’s [TRREB] President, Paul Baron, released their monthly statistical update, “MarketWatch”, this morning covering residential market activity in Toronto, The GTA, and South-Central Ontario reported by area Realtors® through the Board’s MLS® system for the month of June. In short, continued inventory remained relatively confined while sales volume remained relatively strong. Accordingly, the average selling price showed a modest increase of 3.2% compared to the year-earlier period. Due to the strong seasonality of the housing market in the area, all figures quoted herein are year-over-year comparisons unless noted otherwise.
Overall
Including all of TRREB’s market area and all Types & Styles of homes, there were 7,481 sales reported on the month which was a healthy 16.% increase. The average sale price came in at $1,182,120, up 3.2% as noted above. Multiple offer situations were once again seen in many towns and communities across the GTA - particularly for well-presented properties in the mainstream price ranges, not surprisingly given the snug inventory. More on that below…
 Specific Numbers
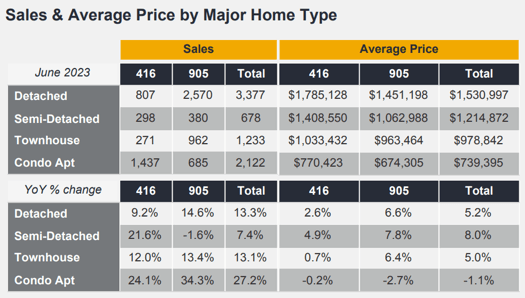
Metropolitan Toronto saw 807 sales of Detached homes reported in June, up 9.2%, at an average selling price of $1,785,128, up 2.6%. The rest of TRREB’s market area - The Greater Toronto as well as some of its more immediate peripheral areas - had 2,570 Detached sales reported, up 14.6%, at an average of $1,451,198, a 6.6% gain.
Condo apartment sales were considerably stronger in volume terms - perhaps a simple function of price point: 1,470 units sold in The 416 [area code], up 24.1%, and 685 sold in the balance of the market area, up 34.3%... but prices were actually softer for this group: The former averaged $770,423, off.2%, while “Out in “The 905”” [area code, generally speaking], that average came to $674,305, down 2.7%.
Demand for Bungalows, BungaLofts and Raised Bungalows - one storey homes, generally speaking - was particularly strong across the area as empty nesters looking to downsize often opt for this more easily navigated - and maintained - Style of home.
Quoted
Toronto Regional Real Estate Board President Paul Baron:
“The demand for ownership housing is stronger than last year, despite higher borrowing costs. With this said, home sales were hampered last month by uncertainty surrounding the Bank of Canada’s outlook on inflation and interest rates. Furthermore, a persistent lack of inventory likely sidelined some willing buyers because they couldn't find a home meeting their needs. Simply put, you can't buy what is not available.”
TRREB Chief Market Analyst Jason Mercer:
“A resilient economy, tight labour market and record population growth kept home sales well above last year’s lows. Looking forward, the Bank of Canada’s interest rate decision this month and its guidance on inflation and borrowing costs for the remainder of 2023 will help us understand how much sales and price will recover beyond current levels."
TRREB CEO John DiMichele:
“GTA municipalities continue to lag in bringing new housing online at a pace sufficient to make up for the current deficit and keep up with record population growth. Leaders at all levels of government, including the new mayor-elect of Toronto, have committed to rectifying the housing supply crisis. We need to see these commitments coming to fruition immediately, or we will continue to fall further behind each month. In addition to the impact of the listing shortage, housing affordability is also hampered on an ongoing basis by taxation and fees associated with home sales and construction as well as the general level of taxation impacting households today. Going forward, we need to look at all of the factors influencing the household balance sheet and people’s ability to house themselves.”
Inventory
The Total Active Listings [TAL] figure came in at 14,107. That’s a pretty significant drop of 12.3% from last June’s [adjusted] 16,087 homes for sale. In terms of the indicated “Forward Inventory” - calculated by dividing the TAL by the month’s Sales volume total to give us a barometer of how long it would take to sell all the existing inventory - that’s about 1.9 months. Sounds like lots but, while it’s quite a bit better than some of the inventory figures we’ve seen lately, it’s still relatively low by historical standards.
“Absorption Rate” indicates how fast the market’s “absorbing” newly listed property and is calculated by dividing the Month’s Sales volume by the number of New Listings. That came to .47 based on June’s figures.
Homes took “6.7% longer” to sell last month at 14 Days on Market [DoM]... still fast by historical standards based on “Listing Days on Market”. Last June the average was 13 days.
…’til next time, thanks again for stopping in… Enjoy your summer! 😎🏊♀️
Questions? Comments? Drop us a line anytime…
Set Up Your Own Customized SmartSearch
What's your property worth today?
JustBungalows.com Home Page
Questions? Comments? ...We'd  to hear from you!
Browse GTA Bungalows by City / Region:
Durham Region | Halton Region | Peel Region | Simcoe County | Toronto by Boroughs | York Region
Browse "Beyond the GTA" Bungalows by City / Region:
Brant & Brantford Township | Dufferin County | Grey County | Guelph & Wellington County | Haldimand County | Haliburton County | Hamilton [City] | Hastings County | Kawartha Lakes | Kitchener-Waterloo & Cambridge | Muskoka District | Niagara Region | Northumberland County | Parry Sound District | Peterborough City & County | Prince Edward County

