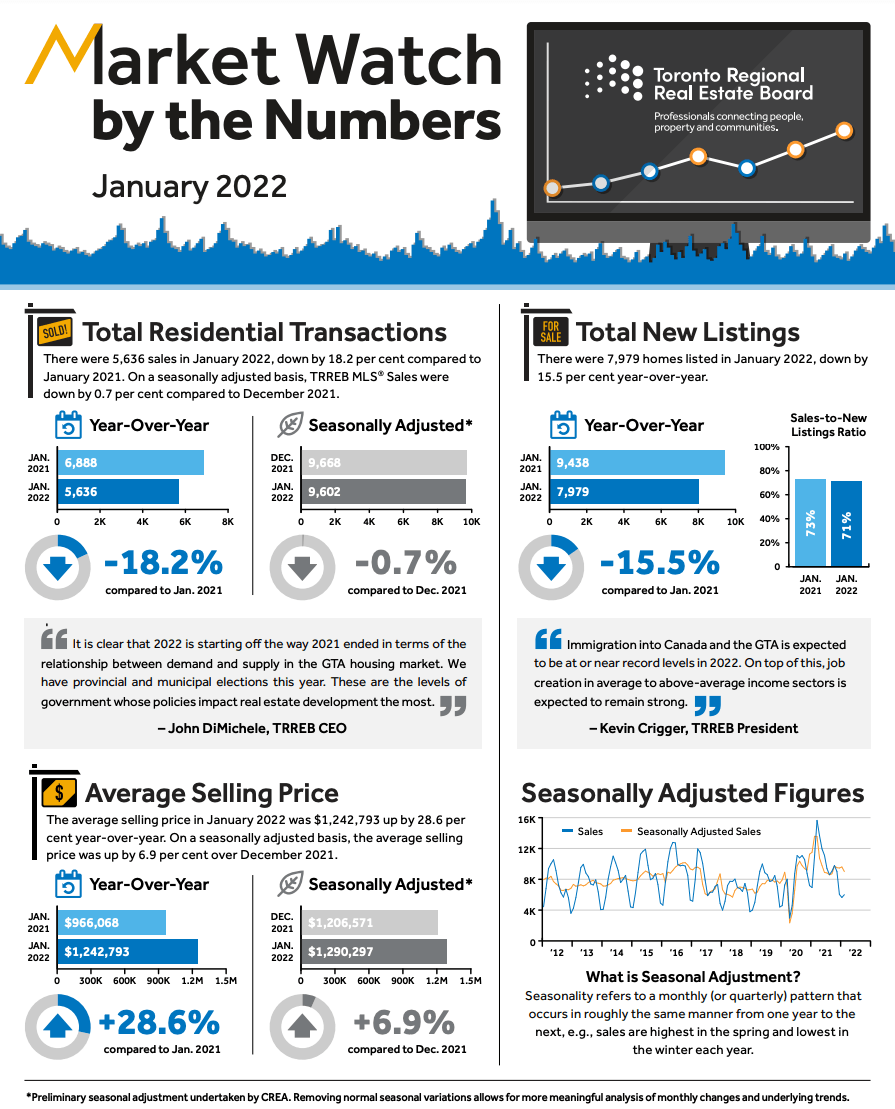
Toronto, Ontario, February 3rd, 2022 - Realtors® in Toronto, the Greater Toronto Area, and South-Central Ontario this morning released the Toronto Region Real Estate Board [TRREB] monthly residential MLS® home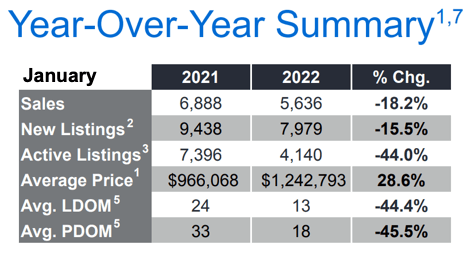 sales statistical publication, MarketWatch, for January, 2022, showing sales volume down significantly compared to January, 2021 as constrained inventory apparently kept a lid on Buyers’ ability to find and purchase a home. To nobody’s surprise, robust demand in the face of low inventory resulted in continued price strength to say the least. All figures herein are year-over-year [YoY] comparisons unless otherwise noted.
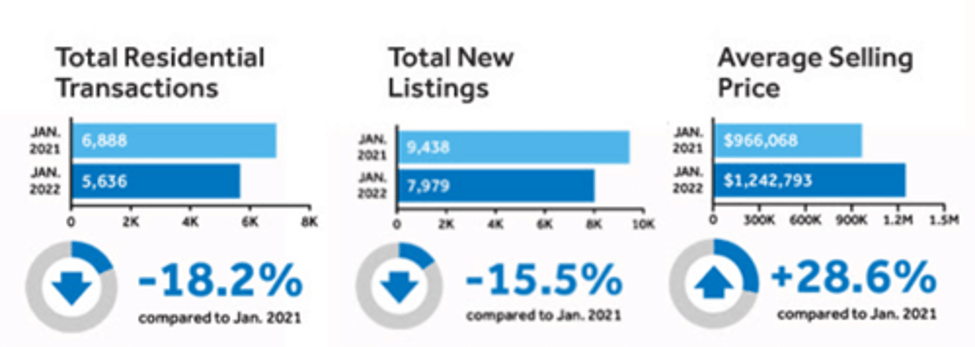
Overall - which includes all home types across all of the Board’s market area - 5,636 home sales were reported on the month, down 18.2%, averaging a selling price of $1,242,793, up 28.6%.
Also not surprisingly, homes sold an incredible “44.4% faster” in January at just 13 days on the market on average versus 24 days in the year-earlier period.
Inventory…
Yeah - it’s still a dirty word… unless you’re a seller. Though there aren’t many of those around these days, even at 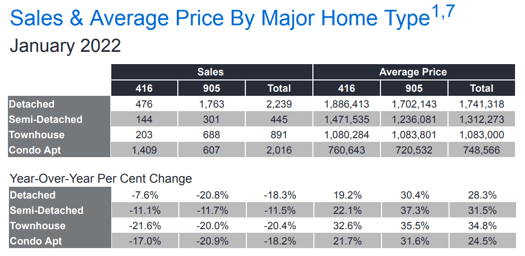 record-high prices. Then again, it’s becoming more and more apparent that the market has shifted to a large degree to investors buying up single family homes in many areas. What some refer to as a “housing shortage” we question. Likely more an issue of market dynamics and, if you buy the “efficient markets” hypothesis you believe this will sort itself out at some point. Meanwhile, there’s anger brewing with some people pointing fingers at Boomers and “matures” owning multiple homes while other folks looking to buy a home to live in are watching as prices quickly spiral out of reach - even at record low interest rates. So, what happens when rates begin to rise?
But are Boomers and “matures” really the problem? Unlikely. Most industry waters we talk to agree that there’s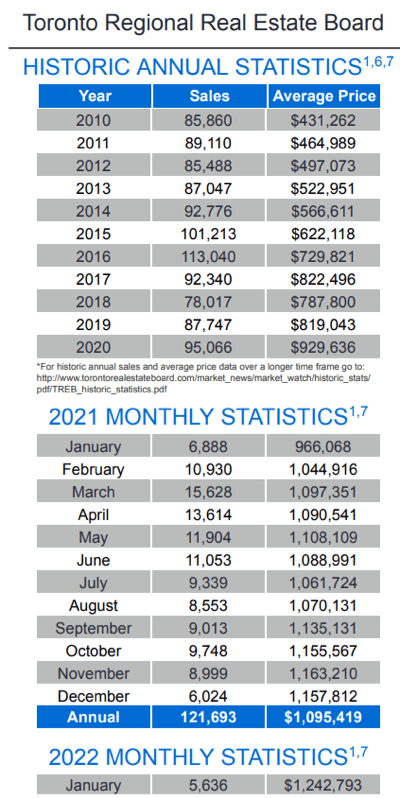 not been much of a shift in that part of the market. Somewhat ironically, there are more middle-aged people buying homes for investment. But the largest issue here might well be the “direct buyer” phenomenon: Maybe you’ve seen the flyers in your neighborhood - depending on where you live - offering to buy your home in any condition - for cash - and with flexible closing dates to make it all easier for you.
People need to be careful here, though. We saw first hand a client come to us to buy a house. They’d sold to one of these outfits - a numbered company, as it turned out - and were very happy with the entire process. That is, until we ran the numbers and they then came to the conclusion that they were probably “out” nearly $100,000 [about 10%] in return for the “convenience”. And - being a principal residence - those were tax-free dollars, don’t forget. Ouch. If it sounds too good to be true…
The Total Active Listings - feelin’ a bit like a broken record here [and, writing that, it occurs to me that many of a particular cohort might have no idea what a “broken record” even refers to… ????] - were once again well-off last year’s already skimpy numbers, down an even forty-four percent to 4,140 homes available for purchase at month-end.
Given the 5,636 homes that were sold during the month, that gives us an implied “Forward Inventory'' - the amount of time it would take for all the homes on the market to sell given the current rate of sales [Total Active Listings divided by Total Sales on the Month] - is about 3 weeks. Extremely tight - which is also reflected by the number multiple-offer [“bidding war”] scenarios persisting in the marketplace, particularly - though by no means limited to - the mainstream price points.
If you’re thinking “Bungalow“, drop us a line. We have - literally - thousands of folks who’ve expressed an interest in buying and/or selling a Bungalow in T.O., the GTA, “and beyond”. The one storey home is certainly at a premium these days as not many have been built over the past few decades, but people want them with their main floor primary [formerly known as “master”] bedrooms and their generally large back yards.
Specific Numbers
Four hundred and seventy-six Detached homes sold in the City of Toronto - “The 416” [area code] - on the month, a 7.6% drop, averaging a sale price of $1,886,413, up [another] 19.2%. Sheesh. How long before we hit two mil?! Maybe not very…
In the rest of the Greater Toronto Area - “The 905” [area code] - 1,763 “Detacheds” were reported sold, off 20.8%, at an average $1,702,143, up just over 30% YoY. Yeah. Unsustainable. Still…
Sales of Condo Apartments came in at 1,409 units in Metro Toronto - down 17% - at an average of $760,643, up 21.7%. The rest of the Greater Toronto Area saw 607 sell, down 20.9%, at an average of $720,532, up 31.6%. Wow.
While the BoC held steady on interest rates at the last meeting, it’s very likely that rates will begin to rise in the near future. Stay tuned…
Thanks for stopping in… “Cheers! ??”... to 2022 being one for the [good] books!
Andrew.
#JustBungalows
#theBB.group
Set Up Your Own Customized SmartSearch
What's your property worth today?
JustBungalows.com Home Page
Questions? Comments? ...We'd ![]() to hear from you!
to hear from you!
Browse GTA Bungalows by City / Region:
Durham Region | Halton Region | Peel Region | Simcoe County | Toronto by Boroughs | York Region
Browse "Beyond the GTA" Bungalows by City / Region:
Brant & Brantford Township | Dufferin County | Grey County | Guelph & Wellington County | Haldimand County | Haliburton County | Hamilton [City] | Hastings County | Kawartha Lakes | Kitchener-Waterloo & Cambridge | Muskoka District | Niagara Region | Northumberland County | Parry Sound District | Peterborough City & County | Prince Edward County

