Toronto, Ontario, January 4, 2024 - Toronto Regional Real Estate Board (TRREB) Realtor® members today released their monthly MarketWatch statistical update for December, 2023 including a bit of year-end commentary & stats on 2023’s total sales & current inventory. While sales were up this December versus last December, total volume came in softer overall for the year and, while “New Listings” were down on the month, “Total Active Listings” were actually up significantly. The latter is, as we’ve asserted here many times before, the more important figure although generally less quoted in industry reports and the mainstream media for whatever reason.
Due to the usually strong seasonality of the residential real estate market, all figures quoted herein are year-over-year [YoY] comparisons unless specifically noted otherwise.
Overall
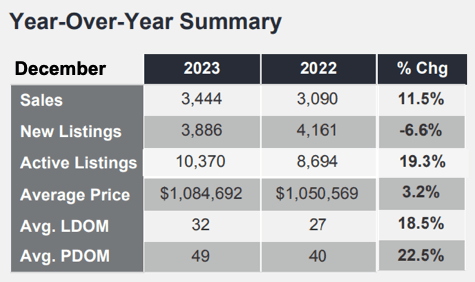
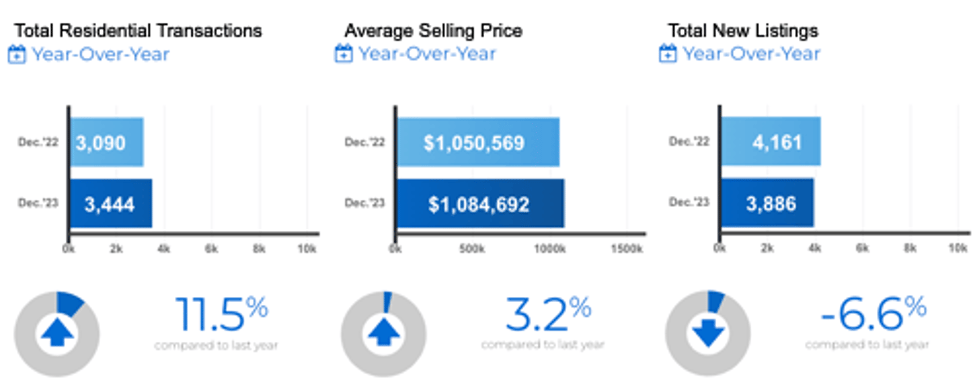
Total home sales volume through TRREB’s MLS® System was reported for the month at 3,444, up 11.5% YoY but down from November’s 4,236. That “seasonality” thing should be mentioned again here particularly as December tends to be one of the  slowest - if not the slowest - month for home sale activity.
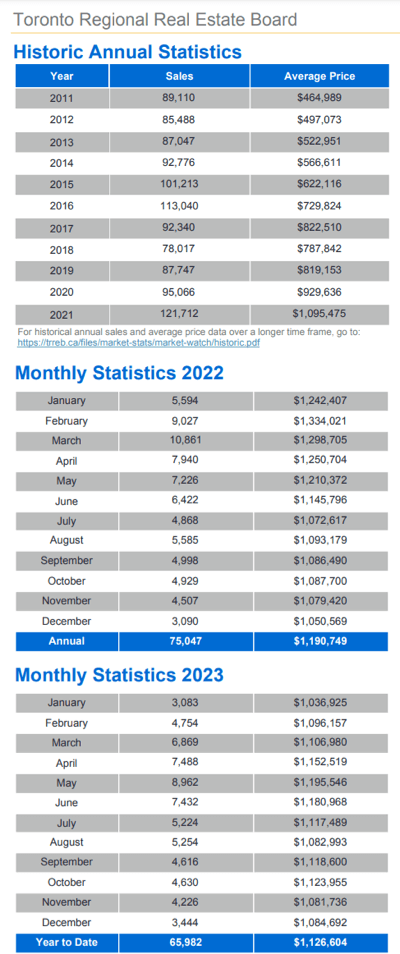
The average selling price was reported as $1,084,692, up 3.2% YoY and virtually unchanged from November’s $1,082,179 [which was, incidentally, also all but unchanged from November, 2022’s average of $1,079,420]. Sales volume totals for those two Novembers - just for the record - were 3,090 homes and 4,507 respectively.
Specific Numbers by the Major Home Types
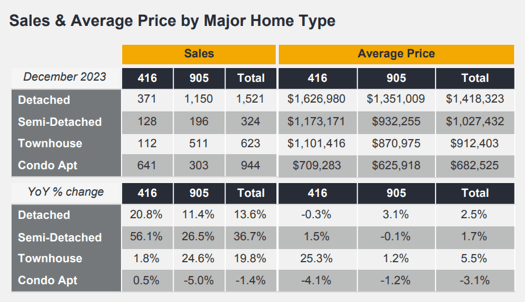
There were 371 Detached home sales reported through the MLS® system in Metro Toronto for the month. That represented a 20.5% jump YoY. The average sale for that Detached group came in at $1,626,980, another “all but flat” at -0.3% YoY [$1,617,918 in November]. The balance of TRREB’s market area - “The 905”, generally speaking - saw 1,150 Detached home sales reported, up 11.4%, at an average selling price of $1,351,009, up 3.1% [$1,333,889 was November’s average there].
Condo Apartment sales volume in Toronto came in at 641, pretty flat again at +0.5%, averaging a sale price of $709,283, off 4.1%. The rest of the GTA saw 303 condo apartment units sell, down an even 5%, at an average sale price of $625,918, down slightly at -1.2%.
Quoting from the report…
Jason Mercer, TRREB Chief Market Analyst:
“Buyers who were active in the market benefitted from more choice throughout 2023. This allowed many of these buyers to negotiate lower selling prices, alleviating some of the impact of higher borrowing costs. Assuming borrowing costs trend lower this year, look for tighter market conditions to prompt renewed price growth in the months ahead.”
Jennifer Pearce, Board President:
“High borrowing costs coupled with unrealistic federal mortgage qualification standards resulted in an unaffordable home ownership market for many households in 2023. With that said, relief seems to be on the horizon. Borrowing costs are expected to trend lower in 2024. Lower mortgage rates coupled with a relatively resilient economy should see a rebound in home sales this year.”
John DiMichele, Board CEO:
“Record immigration into the GTA in the coming years will require a corresponding increase in the number of homes available to rent or purchase. People need to have comfort in knowing that they can plan their lives and future with the certainty that they will have the stability of an affordable place to live.”
On Inventory…
Again, we’ve said many a time that we’re not facing a home shortage crisis [no need to pave The Greenbelt after all!]; what we’re still in the midst of is a housing affordability crisis. To wit, while the number of “new listings” was down in December on a YoY basis, Total Active Listings were up strongly. Again. And the loud calls for the government[s] to “do something” about the “shortage” have, perhaps, finally begun to fade into the background: The numbers don’t lie. While the word “immigration” appeared twice in the report, the word “shortage” didn’t appear at all.
Newly listed properties were down 6.6% YoY to 3,886 homes. It needs to be pointed out that “Newly listed” includes homes that were “re-listed” - often with “price adjustment” [read “reduction”] from the prior listing, though sometimes just to “freshen up” a listing with little or no material change to the listing itself. The re-listing activity is also reflected to a degree in the two “Days on Market” stats. More on that below…
The more relevant inventory number as far as we’re concerned is the Total Active Listings because it’s simply a clearer, more relevant figure. “TAL” was/were up 19.3% to 10,370 on the Board’s MLS® system at month-end. “Shortage”?? The TAL figure reported in November, 2023’s MarketWatch was 16,759, a 40.7% increase over the prior November’s 11,911. Interesting. Though, again, things cool in December on more than the temperature front.
Yet again, Bungalow / Single Storey homes remained in relatively shorter supply as demand outstrips supply in many areas and particularly in the mainstream price points: Many of those Boomers & Matures - the majority fitting the “Empty Nester” profile - would like to both downsize to a one storey home and take some tax free money from the sale of their principal residence off the table to beef up retirement accounts, hand some financial help off to the kids [A.K.A. “The Bank of Mom”!], buy a pair of rag tops and a second shack in the southern sun to hole up for the winters… whatever. By the way - we have Bungalow / Single Storey specific stats covering Toronto, The GTA, and much of South-Central Ontario here on our Bungalow Quick Stats page if you’re interested. There are also links there for more detailed stats by Region / County / Borough, etc.
Regardless, it took an average of 32 days to sell a home in December, “18.5% slower/longer” than last December. That’s the “LDOM” figure - “Listing Days on Market” - which doesn’t reflect a home’s [immediately] previous listings. The “PDOM” number does include immediately prior listings, but only if the seller didn’t change brokers and instead re-listed with the same one. The LDOM number was 49 days, or “22.5% slower/longer” than a year earlier.
It wasn’t that long ago that those Days on Market numbers were down into the “10 days” average range…single digits even in some cases. Those were the good ol’ days of 25 offers on a home with hours of it hitting the market… ahhh, yes. Interest rates have a lot to do with the housing market, of course. And we’re getting news that rates will trend lower this year, likely not until Q3 though. Then again, the people in the know have been wrong on interest rates before. Like… last year. Look it up. While people ask all the time, “Where’s the market gonna be in…?” my go-to answer has become, “I gave up trying to predict the future a long time ago.”! I think that those waiting; perhaps even taking homes off the market because prices have softened and waiting instead for a rebound… dunno… that’s a gamble IMO.
One of the dangers is that, if we don’t get a rebound [and there’s a continued lack of Bungalows for many of these folks to move to], would-be sellers decide to stay put… not sell… #Inventory ??
As always, thank-you very much for stopping by. Here’s hoping ‘24 is a great one for all…
Andrew.
Questions? Comments? Drop us a line!…
Set Up Your Own Customized SmartSearch
What's your property worth today?
JustBungalows.com Home Page
Questions? Comments? ...We'd  to hear from you!
Browse GTA Bungalows by City / Region:
Durham Region | Halton Region | Peel Region | Simcoe County | Toronto by Boroughs | York Region
Browse "Beyond the GTA" Bungalows by City / Region:
Brant & Brantford Township | Dufferin County | Grey County | Guelph & Wellington County | Haldimand County | Haliburton County | Hamilton [City] | Hastings County | Kawartha Lakes | Kitchener-Waterloo & Cambridge | Muskoka District | Niagara Region | Northumberland County | Parry Sound District | Peterborough City & County | Prince Edward County

