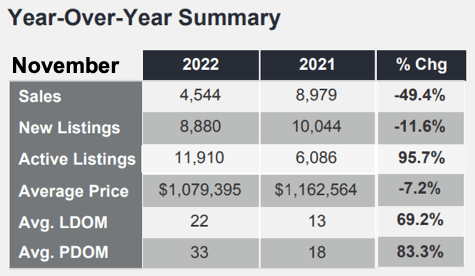
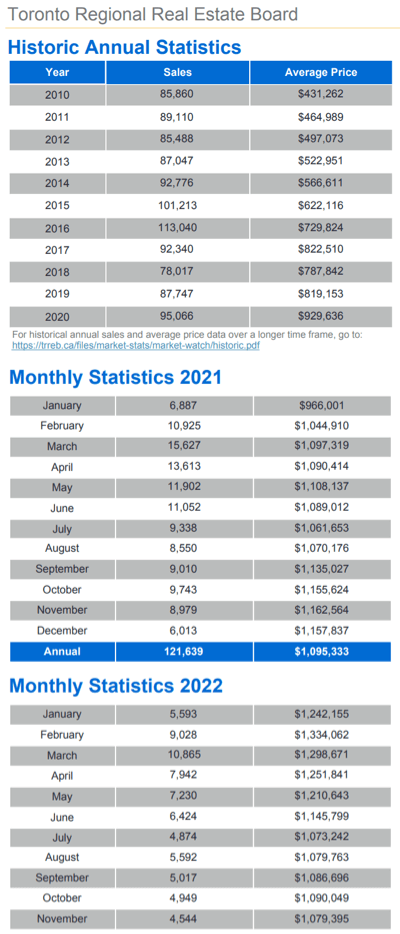
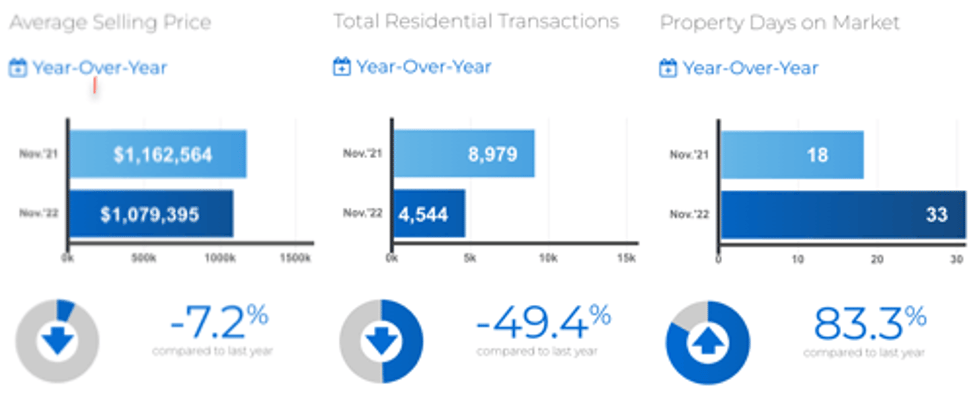
Toronto, Ontario, December 6th, 2022 - “MarketWatch”, the Toronto Regional Real Estate Board’s monthly statistical report was released today showing a continuation of the recent trend - particularly in the sales volume numbers. Home sales across TRREB’s market area were - once again - down more than 49% from the year-earlier month to 4,544 reported via the Board’s MLS® system. The overall - meaning all home types across the entire market area - average sale price fell 7.2% to $1,079,395. All figures quoted herein are year-over-year comparisons - due to the seasonality of the residential real estate market - unless specifically noted otherwise.
While numbers are reported as comparisons to the year-earlier period, it should be noted that the peak in prices to this point came in February, 2022. At that time, for example, the overall average sale price came in at $1,334,544.  The average for a Detached home was $2,073,989 in Metro T.O. and $1,727,963 in the balance of the area. The average “Days on Market” was nine. See below for updates to those latter numbers…
Specific Numbers
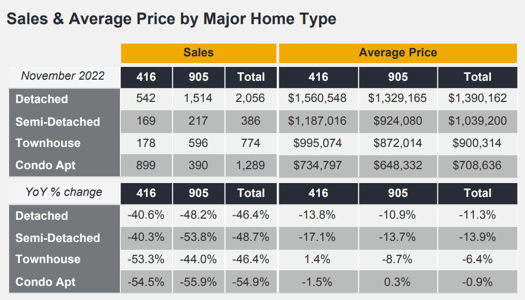
In “The 416” (area code) - Metro Toronto - 542 Detached home sales were reported, a 40.6% drop, at an average sale price of $1,560,548%, off 13.8%. In the balance of the GTA - “The 905", generally - 1,514 Detacheds sold a 48.2% tank. The average sale price there came in at $1,329,165, down 10.9%.
Condo Apartment sales in Toronto were off 54.5% to 899 units averaging $734,797, off slightly at -1.5%. The balance of the GTA saw 390 units sell which was a 55.9% drop and averaging $648,332, the only “real positive” in the report at +.3%.
On the Inventory Front…
The number of properties newly listed on the month totalled 8,880, actually down 11.6%. The more relevant - in our opinion - “Total Active Listings” number was 11,910 at month-end. That was nearly double the inventory at the some time last year at +95.7%. Hmmm…
“Forward Inventory” - calculated by dividing Total Active Listings by the Month’s Sales - gives us an idea of how many weeks or months of available inventory are currently on the market. That works out to 2.62 months. While the increase in homes available is high on the YoY basis, we’ve come out of a period of extremely tight inventory and the current figure is actually much more in line with historical norms. The big question is, “Where do we go from here?”.
The average time it took to sell a home in Toronto and the GTA was 22 Days on the Market [“DoM”]… that was “69.2% slower” versus last November’s 18 days. Like the inventory numbers, though, that’s getting back into line with historic norms - even though it has a ways to go: “The norm” is more in the sixty-to-ninety day range.
Quotable…
TRREB President Kevin Crigger: “Increased borrowing costs represent a short-term shock to the housing market. Over the medium- to long-term, the demand for ownership housing will pick up strongly. This is because a huge share of record immigration will be pointed at the GTA and the Greater Golden Horseshoe (GGH) in the coming years, and all of these people will require a place to live, with the majority looking to buy. The long-term problem for policymakers will not be inflation and borrowing costs, but rather ensuring we have enough housing to accommodate population growth."
Board CEO John DiMichele: “We have seen a lot of progress this year on the housing supply and related governance files such as the More Homes Built Faster Act. This is obviously good news. However, we need these new policies to turn into results over the next year. Otherwise, the current market lull will soon be behind us, population growth will be accelerating, and we will have done nothing to account for our growing housing need. The result would be enhanced unaffordability and reduced economic competitiveness.”
Board Chief Market Analyst Jason Mercer: “Selling prices declined from the early year peak as market conditions became more balanced and homebuyers have sought to mitigate the impact of higher borrowing costs. With that being said, the marked downward price trend experienced in the spring has come to an end. Selling prices have flatlined alongside average monthly mortgage payments since the summer."
Soon the days will begin getting longer… and, before we know it, the Spring Market will be upon us. Should be interesting…
As always, thanks for stopping by. Drop a line anytime with your questions & comments… they’re always welcome - good, bad, or indifferent!
Andrew.
Some other ways we can be of service...
Set Up Your Own Customized SmartSearch
What's your property worth today?
JustBungalows.com Home Page
Questions? Comments? ...We'd ![]() to hear from you!
to hear from you!
Browse GTA Bungalows by City / Region:
Durham Region | Halton Region | Peel Region | Simcoe County | Toronto by Boroughs | York Region
Browse "Beyond the GTA" Bungalows by City / Region:
Brant & Brantford Township | Dufferin County | Grey County | Guelph & Wellington County | Haldimand County | Haliburton County | Hamilton [City] | Hastings County | Kawartha Lakes | Kitchener-Waterloo & Cambridge | Muskoka District | Niagara Region | Northumberland County | Parry Sound District | Peterborough City & County | Prince Edward County

