Toronto, Ontario, Friday October 3, 2025 - Elicia Barry-Sproule, president of the Toronto Regional Real Estate Board [TRREB] today released the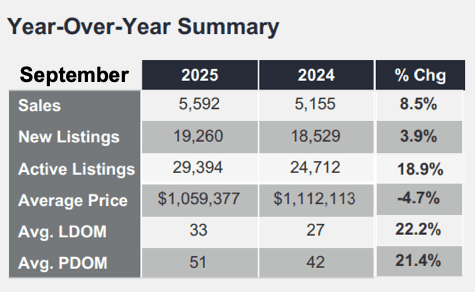 residential real estate monthly statistical update “MarketWatch” for September Confirming a decent pop in sales volume compared to last September, but softer selling prices. Inventory continues to climb from what was already an elevated level.
The Bank of Canada announcing a quarter-point rate cut mid-month obviously helped out on the sales volume side. We’ll see if sales volume continues to rise over the coming months and what impact that may have on prices, particularly in light of the inventory levels.
Interestingly, it was exactly two years ago when we added the byline "Crisis? What crisis?" to our blog post at that time. We were alluding to the buzzword of the day - at least in terms of local residential real estate - "housing crisis". We were always of the mind that what we had was an affordability crisis as opposed to an inventory crisis. At that point in time, we had Total Active Listings at 18,912 homes, and that was a 40% increase from the prior September… which, in turn, had seen a 47% increase in inventory over September 2021 When available listings totaled just 9,191. That we described as "chronic," but not necessarily because we "didn't have enough houses". There were a lot of other factors involved.
Overall
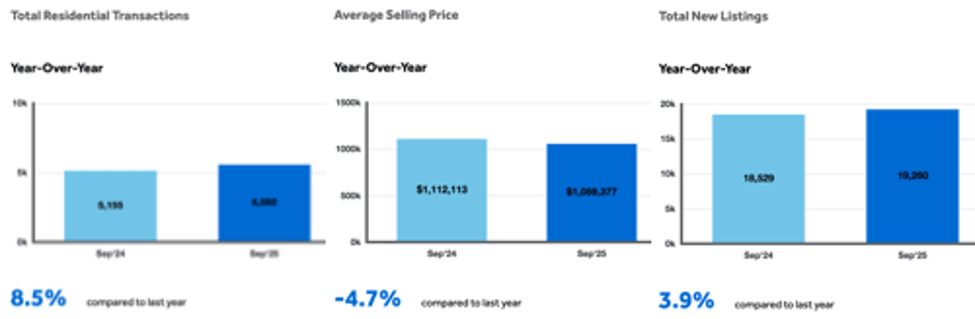
…meaning all home classes, types and styles in the entirety of TRREB’s market area, 5,592 homes “sold firm” on the month - meaning “unconditionally”. That represented a respectable 8.5% increase. Overall, the average sale price was reported as $1,059,377 - a 4.7% decline… more 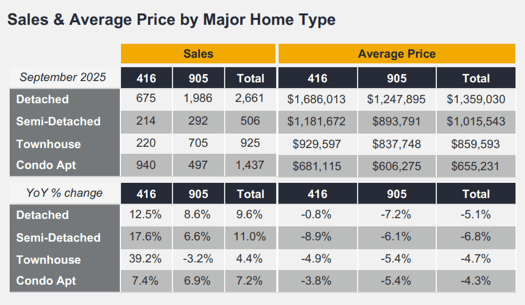 good news for the folks on the Buyer side. Due to the strong seasonality of the residential real estate market, all figures reported herein are year-over-year comparisons unless specifically stated otherwise.
Prices across the board had a minus sign in front of them. The least amount of price decline was seen in Metro Toronto. The increase in sales volume was seen virtually across the board - the sole exception being sales of Townhomes in the "905" area around Toronto. The latter was off 3.2%. Conversely, Toronto proper saw a nearly 40% increase in the sales volume of Townhomes.
Sales of condominium apartments were stronger across the board - though prices were weaker in keeping with the overall trend.
Specific Figures by Home Type…
Metro Toronto saw 675 homes sell in the Detached “group”, up nicely at +12.5%, and an average sale price of $1,686,013, almost unchanged at -0.8%. The rest of the area - the Greater Toronto Area and some pieces on its periphery - had 1,986 Detached homes go under contract, up 8.6%, at an average sell price of $1,247,895, down 7.2%.
Sales of Condo Apartments in Toronto totalled 940 units, up 7.4%, averaging $681,115, off 3.8%. In the rest of the area 497 units sold, up 6.9%, at an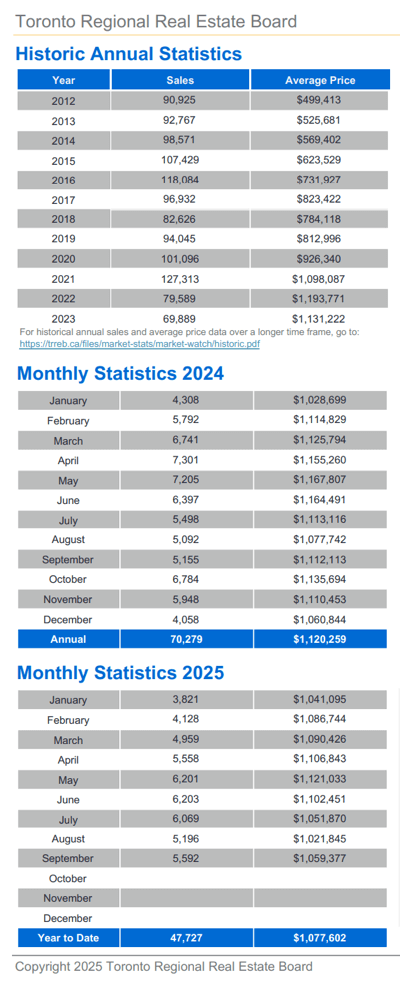 average of $606,275 which was 5.4% lower.
Quoting from the Report:
Board Chief Market Analyst Jason Mercer:
“While home sales have improved over the past year, they still remain below normal levels relative to the number of households in the GTA. Two more 25-basis-point interest rate cuts by the Bank of Canada would see monthly mortgage payments move more in line with homebuyers’ average incomes, further spurring home sales and related economic activity.”
Board President Elicia Barry-Sproule:
“The Bank of Canada’s September interest rate cut was welcome news for homebuyers. With lower borrowing costs, more households are now able to afford monthly mortgage payments on a home that meets their needs. Increased home purchases will also stimulate the economy through housing-related spin-off spending helping to offset the impact of ongoing trade challenges.”
On Inventory
At first glance, it seems contrary to "Economics 101" that sales volume would increase as prices decline… Until you look at inventory. Total Active Listings as of month-end came in at 29,394, up 18.9%. "New Listings" were up 3.9%. We give more weight to the prior figure simply because the latter figure also includes listings that were terminated or expired and then re-listed… meaning that some percentage of those are not really "new" at all.
“Forward Inventory” - a relatively crude indicator of where we are in terms of available inventory - is calculated by dividing "Total Active Listings" by the month's "Total Sales” [volume] to give us an idea of how long it would take to clear all current listings in the form of sales given a constant rate of sales volume. That works out to about 5¼ months of inventory - on the high side, particularly given the relatively low sale volume.
What's most popular right now are homes in the mainstream and lower price points and - as they have been for a very long time and as indicated by the activity on this website - Bungalows / Single Storey homes across the market area are in high demand and comparatively low supply.
Not surprisingly, homes sold "22.2% slower" on the month at 33 days on the market on average before selling vs 27 last September.
As always, thank you for stopping by. What a beautiful stretch of weather we've had. Time to get the place ready for winter, and looking forward to a Happy Hallowe’en! 🎃🧙
Andrew.
Questions? Comments? ...We'd ❤️ to hear from you: You can drop us a line here!...
Set Up Your Own Customized SmartSearch
What's your property worth today?
Browse GTA Bungalows by City / Region
Durham Region | Halton Region | Peel Region | Simcoe County |
Toronto by Boroughs | Toronto by Neighbourhoods | York Region
Browse "Beyond the GTA" Bungalows by City / Region
Brant & Brantford Township | Dufferin County | Grey County | Guelph & Wellington County | Haldimand County | Haliburton County | Hamilton [City] | Hastings County | Kawartha Lakes | Kitchener-Waterloo & Cambridge | Muskoka District | Niagara Region | Northumberland County | Parry Sound District | Peterborough City & County | Prince Edward County

