Greater Toronto, Ontario, October 3rd, 2024 - The Toronto Regional Real Estate Board’s [TRREB’s] monthly residential market activity statistical report, MarketWatch, was released this morning by Board president Jennifer Pearce. The report provides a detailed update of MLS® home listings and sales across the Board’s market area including Metro Toronto, The GTA, and the surrounding portions of South-Central Ontario that Realtor members of the Board primarily serve, including the area known as the Greater Golden Horseshoe.
Overall
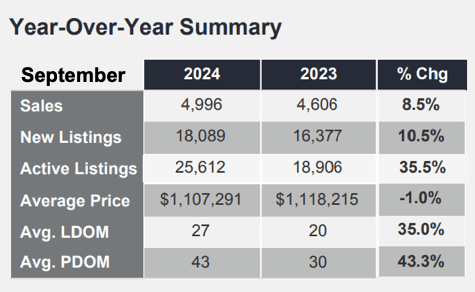
“Overall” - meaning all home classes, types and styles across all of TRREB’s market area - Board members reported 4,996 homes sold in September which was an 8.5% increase versus the same month a year earlier. Besides that “positive”, the only other positives in the big picture were actually the “negatives” - meaning New Listings, Total Active Listings [TAL], and the number of days it took for homes to sell, on average.
Inventory - as represented best by that “TAL” figure - continued to expand. More details on those inventory-related numbers below.
 The overall average selling price of homes last month came in at $1,107,291 which was a drop of one percent.
With the US economy showing decent strength of late we’ve actually heard whispers that anticipated cuts to interest rates may not be as aggressive as hoped. Not great news - obviously - for the housing market… and generally the Bank of Canada follows - sooner or later - the actions of the US “Fed”.
All figures herein are - due to the usual strong seasonality of the residential real estate market - year-over-year comparisons except where specifically noted otherwise.
Specific Numbers by Home Type
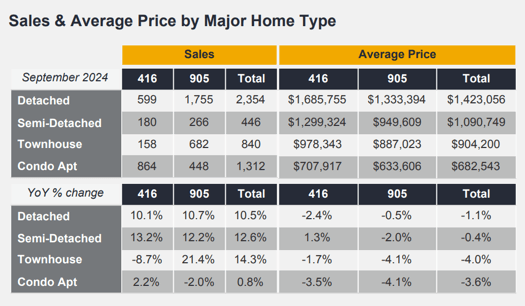
Metro Toronto - a.k.a. “The 416” area code - saw 599 sales of Detached homes reported, a healthy 10.1% rise, averaging $1,685,755, down 2.4%. In “The 905” area code representing much of the balance of TRREB’s market area, generally speaking - 1,755 sales of Detached homes reported, up 10.7%, averaging $1,333,394, virtually flat average price wise at -0.5%.
Condominium Apartment sales - which have had a rough go of late - at least “stabilized” to some degree YoY in September. In Metro T.O., 864 units were reported sold, up 2.2%, at an average sale price of $707,917, off 3.5%. The rest of TRREB’s market area had 448 sales, down an even 2%, averaging $633,606, off 4.1%.
Quoting… from the Report:
Jennifer Pearce, TRREB President:
“As buyers take advantage of changes to mortgage lending guidelines and borrowing costs trend lower, home sales will steadily increase in relation to population growth. With every rate cut, a growing number of GTA households will afford a long-term investment in home ownership, including first-time buyers.”
John DiMichele, TRREB CEO:
“We are pleased with the positive changes to mortgage lending guidelines announced over the past month. The ability for existing mortgage holders to shop around for the best rate without facing the stress test will result in more affordable renewals. Longer amortization periods and the ability to insure mortgages for purchases over $1 million dollars will give home buyers more options as the GTA housing market recovers. TRREB has long been calling for these changes to give buyers more flexibility as they navigate their home buying journey.”
Jason Mercer, TRREB Chief Market Analyst:
“The annual improvement in September home sales was more than matched by the increase in new listings over the same period. This resulted in a better-supplied market and increased negotiating power for buyers re-entering the market. The ability to negotiate on price, led to moderate year-over-year price declines, particularly in the more affordable condo apartment and townhouse segments, which are popular with first time buyers.”
Updating the Inventory Situation
That Total Active Listings figure referenced above tells much of the story: 25,612 homes available for sale. We’ve come a long way from the days of “a couple of weeks of forward inventory” which, of course, prompted wide-spread calls of a “housing shortage”. Well, there was a housing shortage in the context of demand. But, with prices rising at unsustainable levels, that situation itself was unsustainable and a “natural” market-forces correction would come at some point as we asserted many times here.
Dividing TAL by the month's sales volume gives us "Indicated Forward Inventory" which is an indication of how long it’ll take to “clear” all the current listings for sale given a constant rate of sales volume. At September month-end, “FI” stood at over five months. That’s high versus historical norms. Shortage shmortage. The real problem remains affordability which, in time, may or may not see one of those “natural” market normalizations. Prices have obviously come off the peaks seen in, generally, the winter of ‘22 but remain out of reach for many still.
Once again we saw very strong demand in the market for Bungalows / Single Storey Homes for sale in Ontario - a smaller segment of the market that may well be in a “shortage” situation as empty nesters look to downsize. Multiple offer situations occur relatively regularly - particularly for these homes in good condition and located in the higher demand areas… read “reasonable proximity to major amenities” and the more mainstream price points.
Here’s to a fabulous fall - hope you get a chance to enjoy some Thanksgiving 🦃🍗family time! …and remember: in spite of the decent weather, we’ve usually seen some frost and even snowflakes ❄️❄️ falling by the time Hallowe’en rolls around! Get outside and enjoy the fall 🍂🍁🎃 colours! And thanks, as always, for reading. Drop a line if you have real estate related questions or comments… they’re always welcome.
Andrew
#theBB.group
#JustBungalows
Questions? Comments? ...We'd ❤️ to hear from you: Drop us a line here!...
Set Up Your Own Customized SmartSearch
What's your property worth today?
Browse GTA Bungalows by City / Region
Durham Region | Halton Region | Peel Region | Simcoe County |
Toronto by Boroughs | Toronto by Neighbourhoods | York Region
Browse "Beyond the GTA" Bungalows by City / Region
Brant & Brantford Township | Dufferin County | Grey County | Guelph & Wellington County | Haldimand County | Haliburton County | Hamilton [City] | Hastings County | Kawartha Lakes | Kitchener-Waterloo & Cambridge | Muskoka District | Niagara Region | Northumberland County | Parry Sound District | Peterborough City & County | Prince Edward County

