
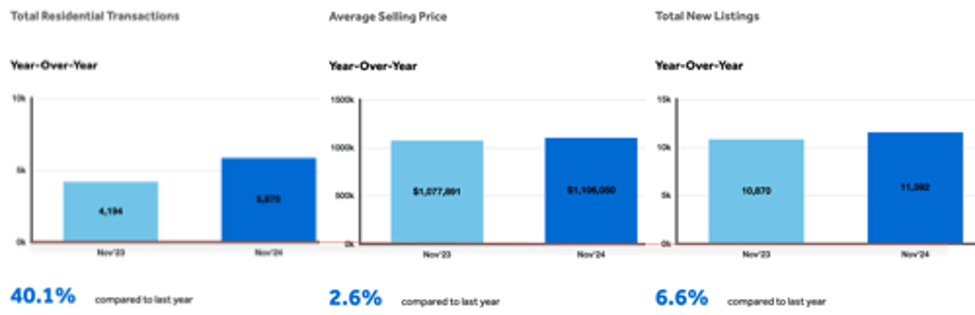
Greater Toronto, Ontario - December 4th, 2024 - Toronto Regional Real Estate Board [TRREB] President Jennifer Pearce this morning released “MarketWatch”, the board’s monthly statistical report, showing that the softening of prices in the earlier stages of this year combined with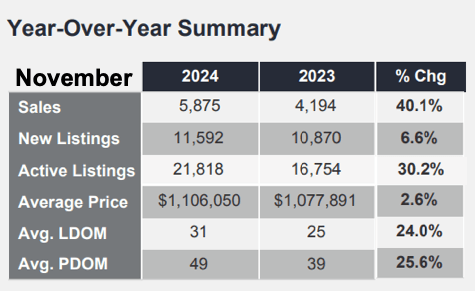 moderating mortgage rates combined to bring buyers off the sidelines as reflected in the forty percent jump in sales volume compared to the year-earlier period.
It should be noted that the home price “peak” occurred in February, 2022 when the overall average was $1,334,544 and Detached homes in Metro T.O. averaged $2,073,989; $1,727,963 for the rest of the market area. Average “DOM” [Days on Market] was 9.
TRREB’s report covers MLS® activity reported by Board Realtor® members across TRREB’s geographic market area which includes Metropolitan Toronto, the rest of The Greater Toronto Area, and some surrounding portions of The Greater Golden Horseshoe area.
Due to the strong seasonality of the residential real estate market, all figures quoted herein are year-over-year comparisons unless specifically noted otherwise.
The Big Picture
While strong increases in sales volume came across-the-board, it was the “Freehold” [e.g. non-Condo] class of home that saw prices rise as inventory for that group remained somewhat constrained versus the Condo group in which average prices were flat-to-lower as inventory there remained elevated.
 Including all Classes [Freehold, Condo…], Types [Detached, Townhome, Apartment…] and Style [Single Storey, 2-Storey, Split-Level…] of home, members reported 5,875 firm transactions, up 40.1%, at an average selling price of $1,106,050, up 2.6% which is a hair above the current rate of inflation.
Homes “newly” listed for sale were up 6.6%, but note that that figure includes listings of homes re-listed after being terminated - and re-listed for sale with the same broker - usually coincident with a “price improvement” as it’s called these days… 99.99% of the time that means, of course, a price reduction. More on the current inventory situation below…
Specific Numbers by Home Type
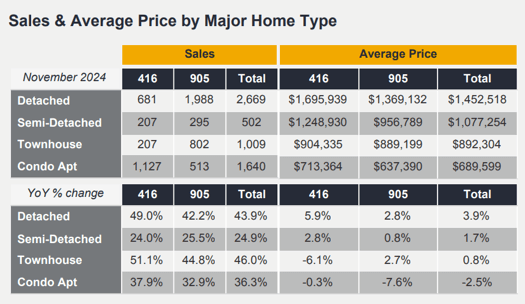
“The 416” (area code) - Metro Toronto - saw 681 sales of Detached homes reported, a 49% spike, averaging a sale price of $1,695,939%, up 5.9%. The balance of the GTA - “The 905" (area code), generally - saw 1,988 Detacheds sold, up a strong 42.2%, at an average sell price of $1,369,132, up 2.8%.
Bungalows / Single Storey homes remained - not surprisingly - across "Toronto, The GTA, and Beyond!"...
Metro Toronto Condo Apartment sales were up an impressive 37.9% to 1,127 units at an average of $713,364, almost unchanged at -0.3%. The rest of the area saw 513 units sell, up 32.9%, averaging $637,390, down 7.6% which was the “worst” number in the report… from the sellers’ standpoint at least.
Quoting…from the Report:
TRREB President Jennifer Pearce:
“As we approach the end of 2024, I am pleased to report an improvement in housing market conditions. Many home buyers patiently waited on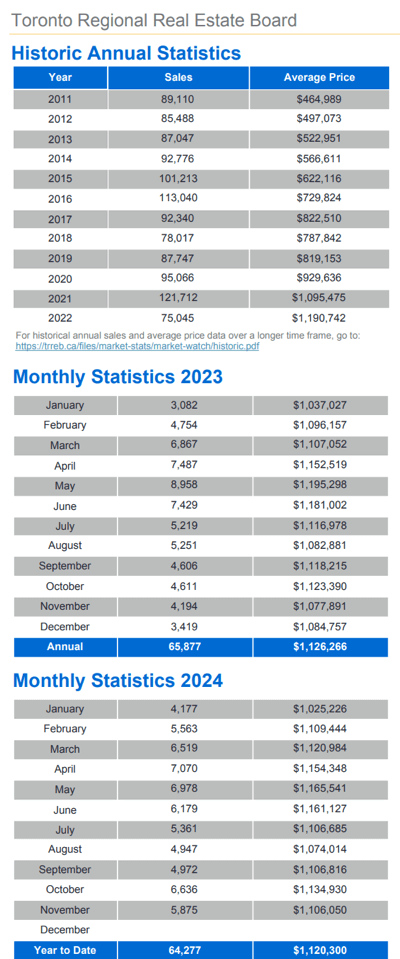 the sidelines for reduced inflation and lower borrowing costs. With selling prices remaining well off their historic peak and monthly mortgage payments trending lower, the stage is set for an accelerating market recovery in 2025.”
TRREB Chief Market Analyst Jason Mercer:
“Market conditions have tightened, particularly for single-family homes. The detached market segment experienced average annual price growth above the rate of inflation, particularly in the City of Toronto. In contrast, the condominium apartment segment continued to experience lower average selling prices compared to a year ago. Condo buyers are benefitting from a lot of choice and therefore negotiating power. This will attract renter households into homeownership as borrowing costs trend lower in the months ahead.”
TRREB CEO John DiMichele:
“Reforming the LTB [Landlord and Tenant Board] to make it faster and fairer will go a long way to getting more individuals and families into homes they can afford.”
On Inventory…
“New” listings - as mentioned above - totalled 11,592 on the month, up 6.6%. More relevant, “Total Active Listings” were 21,818 at month-end, up 30.2%.
“Forward Inventory” is calculated by dividing Total Active Listings by Sales Volume to give us a snapshot of weeks of currently available inventory: That came to about 16 weeks of inventory… getting up there by historical standards but - also as alluded to above - Condo Apartments in particular comprise a hefty portion of that inventory. Apologies - specific breakdowns were not available at time of writing.
“Absorption Rate” is the rate at which the market is “absorbing” inventory in the form of sales. It’s calculated by dividing Total Sales by New Listings [which - as we’ve repeated here ad nauseam - is a bit of a wonky figure because of the way the latter is calculated as noted above] and came in at .507 on the month.
That “DOM” figure - the average time it took to sell - was 31 Days on the Market… “24% slower” compared to 25 days last November. The “norm” for DoM, historically speaking, is more in the 75 day range so things - on average, at least - are still pretty warm out there by that measure.
The “Property Days on Market” indicated in the charts, by the way, takes into account those “re-listed” properties and how many days homes actually took to sell including those ones… but - again - that’s somewhat skewed by the fact that it only reflects properties re-listed by the same brokerage - not the ones that switched to a new agent / broker on re-listing. The obvious take-away there is that that figure is, in reality, somewhat higher than indicated in the chart.
Pretty soon the Holidays will be upon us - generally the slowest time of the year for home sales in our market - and the days slowly begin getting longer… then Spring 🌷🌷🌱🌱! As always, we appreciate you reading. Drop a line via the link below with any “Qs”, comments… always welcome - good, bad, or ugly!
Andrew.
#theBB.group #JustBungalows
Questions? Comments? ...We'd ❤️ to hear from you: Drop us a line here!...
Set Up Your Own Customized SmartSearch
What's your property worth today?
Browse GTA Bungalows by City / Region
Durham Region | Halton Region | Peel Region | Simcoe County |
Toronto by Boroughs | Toronto by Neighbourhoods | York Region
Browse "Beyond the GTA" Bungalows by City / Region
Brant & Brantford Township | Dufferin County | Grey County | Guelph & Wellington County | Haldimand County | Haliburton County | Hamilton [City] | Hastings County | Kawartha Lakes | Kitchener-Waterloo & Cambridge | Muskoka District | Niagara Region | Northumberland County | Parry Sound District | Peterborough City & County | Prince Edward County