Greater Toronto, Ontario - Thursday April 3, 2025 - Toronto Region Real Estate Board [TRREB] President, Elechia Barry-Sproule, this morning released the residential MLS® sales for March 2025 via “MarketWatch” - the Board’s monthly housing market stats publication. Once again - to exactly nobody’s surprise - homes in Toronto and The Greater Toronto Area continued to sell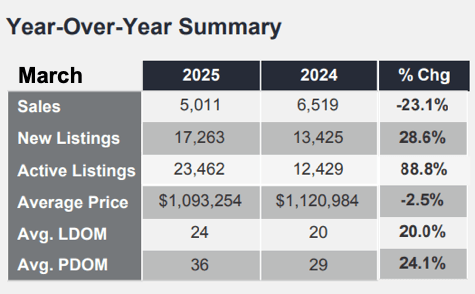 at a considerably lower rate compared to last March… and Beyond!... though prices held up relatively well despite sales volume and rising inventory as buyers enjoyed more choice and far less pressure than they’ve had in a long time.
That said, there are still multiple offer scenarios involving homes in the more moderate price ranges. Bungalows / One Storey Homes in particular remain popular as Boomers & Empty Nesters downsize and take cash off the table to pad retirement accounts - a trend we see continuing for a long time yet.
Specifically with respect to that currently coveted Single Storey Lifestyle, go to "Bungalows / “single storey” homes for sale & sold in Toronto, The GTA, and South-Central Ontario" and the “Bungalow Quick Stats” page [Resources area of the site]. You can also get there by using the main Menu links above. That gives you detailed info on “1 Storey Home Specific” information [Sales Volume, Ask & Sell Prices, List-to-Sale % ratio, Beds / Baths, Taxes…], broken down by Cities and Regions including a reference map and links to “archives” of that info going back to 2019. Hope it’s of use to you! Feel free to reach out if you’d like additional info on specific Bungalow-friendly Towns, Areas, Communities or Neighbourhoods.
While mortgage rates are at historically attractive levels for home buyers, an extreme of political - read “economic” as well - uncertainty and volatility persists. Another trend we’re likely to see continue for obvious reasons. Hopefully the upcoming Canadian election will bring some degree of stability.
Overall…
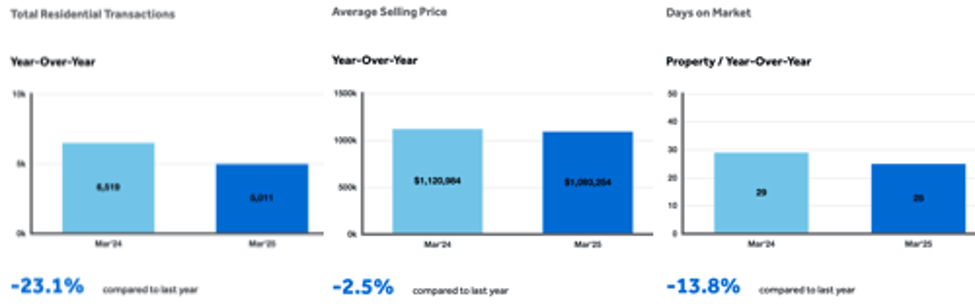
…including all “Classes” of home [Freehold, Condominium, Land Lease, etc] and “Types” of home [Detached, Semi-Detached, 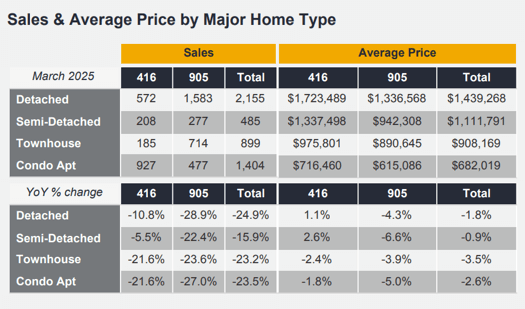 Linked, Townhome, Condos, etc] throughout the Board’s market area the average sale price for March came in at $1,093,254. That was 2.5% lower than last March - not bad given the drop in volume and the rise in inventory.
Volume - total sales on the month - came in at 5,011 sales reported, down 23.1% from 6,519 a year earlier. All stats reported here are year-over-year [YoY] comparisons which is usually most relevant given the usual strong seasonality of the housing market: Spring is usually most robust for sales followed by Fall with the dog days of Summer and the December 1st thru end of January “seasons” being significantly slower. What’s interesting is how this has changed, first by the COVID pandemic and more recently by political / economic / social developments - both domestic and international.
A Closer Look at the Statistics by "Major Home Type"
The drop in sales volume was pretty broad-based, though did differ significantly by geographic area. The Detached homes group within Metropolitan T.O. - “The 416” [area code] - was down 10.8% to 572 selling at an average $1,723,489. While that was a slim gain of 1.1%, it was welcome nonetheless to those sellers as it was one of very few “+” signs in the report.
In the balance of the market area - The GTA outside the city proper, or “The 905” generally speaking - 1,583 Detached homes sold, down 28.9%, averaging $1,336,568, off 4.3%.
Condominium Apartment sales totalled 927 in Metro Toronto, a 21.6% drop, at an average sale price of $716,460 off 1.8%. The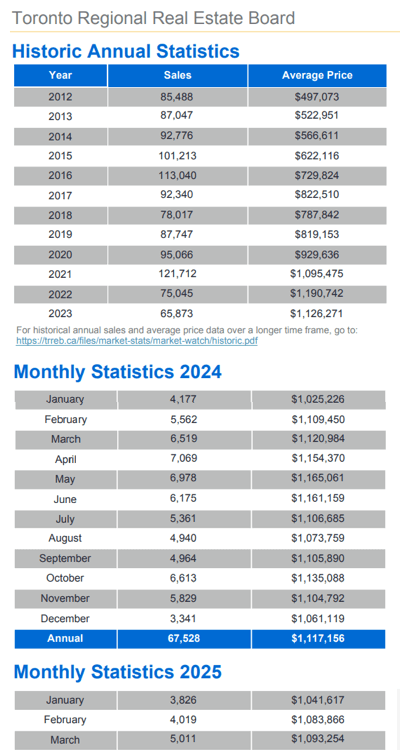 balance of the area saw 477 Condo Apartment sales on the month, off an even 27%, averaging $615,086, down 5% even. Condo Apartments are unlikely to fare any better for the foreseeable future: By some estimates, available inventory is running at between two and 2.5 times the ten year average. With numbers like that we have to wonder: Who wouldn’t wait to buy unless there’s some other factor forcing their hand?
Quotable…
Board Chief Statistical Analyst Jason Mercer:
"Given the current trade uncertainty and the upcoming federal election, many households are likely taking a wait-and-see approach to home buying. If trade issues are solved or public policy choices help mitigate the impact of tariffs, home sales will likely increase. Home buyers need to feel their employment situation is solid before committing to monthly mortgage payments over the long term.”
Board CEO John DiMichele:
“While the policy debate heading into the federal election has rightly been focused on our cross-border trade relationship, it has also been important to see that the federal parties continue to view housing as a key priority based on the various election platforms. This is in line with recent polling suggesting access to housing options that are affordable remains top-of-mind for all Canadians. Building this housing will be a key economic driver moving forward.”
Board President Elechia Barry-Sproule:
“Homeownership has become more affordable over the past 12 months, and we expect further rate cuts this spring. Buyers will also benefit from increased choice, giving them greater negotiating power. Once consumers feel confident in the economy and their job security, home buying activity should improve.”
More On the Inventory Front
Total Active Listings [TAL - or, simply, “Active Listings” in the MarketWatch report] is, as far as we’re concerned, a far more relevant - though generally less referenced - indicator of inventory than “New Listings”... especially now as we’ve shifted from Seller’s Market to Buyer’s Market. Here’s why: The latter includes homes terminated and re-listed… so they’re not really “New”. With the shift to Buyer’s Market it’s far more common for Sellers and their agents to “adjust” the asking price after a home has been on the market for any length of time.
Understandably, sellers elect to “improve” their asking price - assuming they do want to sell. Back in the “old days” the Board used to charge the agents to “re-run” a listing - which really just meant to “edit” it. But “modern” practice is to actually terminate and completely re-list the property coincident with a price change [though sometimes just to “freshen up” the listing with no adjustment in asking price. This “re-listing” practice then distorts the actual number of homes coming onto the market as “New Listings". TAL is simply that - total available inventory.
At month-end, the TAL figure stood at 23,462. That’s getting close to double the inventory available a year ago at “+88.9%” and - even though a good chunk of that jump comes in the form of Condo Apartments - it’s still very much welcomed by anyone on the buyer side of the fence as we’ve noted previously.
“New Listings” totalled 17,263 on the month - still a healthy [particularly from the Byers’ perspective!] 28.6% jump YoY.
The inventory situation can also be illustrated by “Forward Inventory” figure - Total Active Listings over the month’s Sales volume - thus estimating how many months it would take to “clear” all current inventory in the form of sales assuming present volume continued. For March that worked out to [23,462 / 5,011] about four-and-two-thirds months. A year earlier it was just under two months - which we suggested was “Still “snug"”... a little tight… by historical standards [which tend to be in around the 90 day mark]. Oh, how quickly a market can turn. Elon and many others would no doubt concur… but let’s not go there.
What’s - arguably - one of the more interesting statistics in the March report is the Days on Market [DoM]. Despite the inventory situation the homes that did sell sold more quickly this March at 24 days versus 20… that’s “20% faster”. Go figure. And that’s also relatively quick, historically speaking. And that’s “Listing Days on Market” [LDOM] rather than “Property Days on Market [“PDOM”]. Here - as we’ve written before since many folks don’t understand - is the difference:
The “LDOM” versus “PDOM” quoted in the charts: Listing Days on Market represents the average number of days homes took to sell during the listing contract term in place when the home actually sold. Property Days on Market represents the number of days the property took to sell including previous listings with the same brokerage. Bottom line: PDOM is actually more accurate in terms of how long homes are taking to sell currently, but it’s actually an “incomplete” statistic in that it doesn’t include the days on the market in cases where a seller re-lists with a different broker.
As always, we appreciate you stopping by…! Have a fabulous Spring “...and Beyond…”. 🌱🌹🌼🌸🌤️🥰
Andrew.
#JustBungalows
#theBB.group
Questions? Comments? ...We'd ❤️ to hear from you: Drop us a line here!...
Set Up Your Own Customized SmartSearch
What's your property worth today?
Browse GTA Bungalows by City / Region
Durham Region | Halton Region | Peel Region | Simcoe County |
Toronto by Boroughs | Toronto by Neighbourhoods | York Region
Browse "Beyond the GTA" Bungalows by City / Region
Brant & Brantford Township | Dufferin County | Grey County | Guelph & Wellington County | Haldimand County | Haliburton County | Hamilton [City] | Hastings County | Kawartha Lakes | Kitchener-Waterloo & Cambridge | Muskoka District | Niagara Region | Northumberland County | Parry Sound District | Peterborough City & County | Prince Edward County

