Greater Toronto, Ontario - Thursday August 6th, 2025: The Toronto Regional Real Estate Board’s [TRREB] monthly residential MLS® statistical update, MarketWatch, was released by Board President Elechia Barry-Sproule this morning showing a continuation of the trend we've seen over the past couple of years: prices continue to slip while inventory builds.
The report tracks - generally, due to the strong seasonality of the residential real estate market - year-over-year activity as reported by member Realtors® through TRREB’s MLS® [Multiple Listing Service] system. “All figures herein are year-over-year comparisons unless otherwise noted.”
Looking at Metro Toronto, the Greater Toronto Area, and its peripheral portions of South-Central Ontario that are included in TRREB’s market area, we asked "AI" to do a quick comparison of the generally accepted peak in housing market activity being February 2022 versus the August 2025 stats. Here's a quick synopsis of what we got back from the bot 🤖🤖🤖 [Google Gemini - just for “transparency”... & edited slightly by a human - just for clarity 😉]:
“The period from the February 2022 peak to August 2025 saw a dramatic correction in the Toronto and GTA residential market, characterized by significant drops in sales and prices, paired with a massive surge in inventory. Specifically focusing on the low-rise segment (Detached, Semi-Detached, and Townhouse), sales volume plunged by nearly 39.6%, while average prices for these core home types fell between 23.3% and 27.9%. Overall market activity dropped sharply, with total sales declining by approximately 42.8% and the composite average price decreasing by 23.4%. The most substantial shift, however, was in market availability, as Active Listings soared by a staggering 293.6%, fundamentally changing the market from a severe seller's advantage in 2022 to one heavily weighted with inventory by mid-2025.”
While our primary focus here is specifically on the Bungalow / Single Storey homes market, unfortunately TRREB does not generally break out statistics by style of home. We do offer a Bungalow-specific month-by-month summary in our Bungalow “QuickStats” market update.
Overall
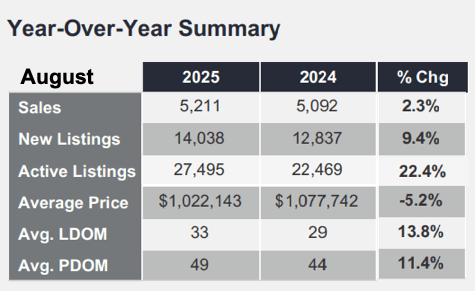
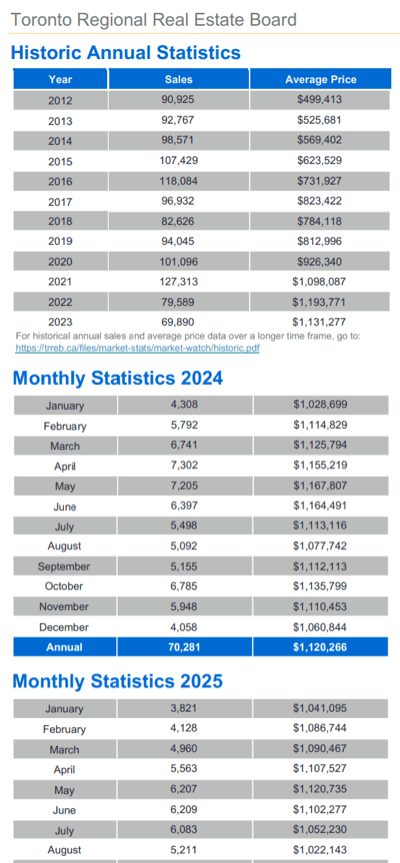
 Residential sales Volume on the month totalled 5,211. That's actually a 2.3% increase versus last August and includes - just to be clear - all Classes, Types, & Styles of home. “Classes” meaning Freehold, Condo, Co-Operative, Land Lease, etc. “Types” would be Detached, Townhome, Apartment, etc. “Style” is more about architecture, as in 2-Storey, Bungalow / 1-Storey, Backsplit...
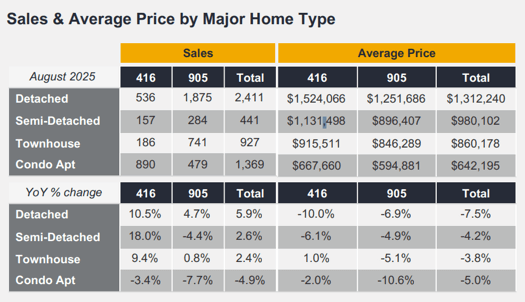
Sales volume stats were mixed with the Detached group showing the most strength by this metric. Freehold Townhomes were up 18% YoY in Toronto “proper’. Average sale prices on the other hand were - literally down across the board.
The Numbers by Home Type
In “The 416” - Metropolitan Toronto - 536 Detached homes “sold firm” [e.g. unconditionally], up 10.5%, at an average of $1,524,066, down an even ten percent. Ouch. Unless you’re on the “Buy side”, of course. “The 905" - the balance of the market area, very generally speaking - 1,875 “Detacheds” were reported sold, up 4.7%, at an average of $1,251,686, off 6.9%.
Condo Apartment sales were down in all TRREB’s market areas while prices were “flat-to-down”: Toronto itself saw 890 “Condos” sell, off 3.4%, at an average of $667,660, off two percent. In the balance of the area 479 sold, down 7.7%, averaging $594,881, down 10.6%. Hmmm…
“Quoting…” from the Report…
TRREB Chief Market Analyst Jason Mercer:
“A household earning the average income in the GTA is still finding it challenging to afford the monthly mortgage payment associated with the purchase of an average priced home. This is even with lower borrowing costs and selling prices over the past year. Further relief in borrowing costs would see an increased number of buyers move off the sidelines to take advantage of today's well-supplied market.”
TRREB CEO John DiMichele:
“New, large scale infrastructure projects, including affordable housing, public transit, ports and shipbuilding will be important for sustaining Canada’s economic sustainability in the medium-to-long term. However, in the short term, spurring consumer spending on large ticket items like housing could lead recovery, as it has in previous economic cycles.”
TRREB President President Elechia Barry-Sproule:
“Compared to last year, we have seen a modest increase in home sales over the summer. With the economy slowing and inflation under control, additional interest rate cuts by the Bank of Canada could help offset the impact of tariffs. Greater affordability would not only support more home sales but also generate significant economic spin-off benefits.”
On Inven⬆️ory…
Homes “newly listed” in August totalled 14,038, up 9.4%. “Total Active Listings” - the more relevant inventory statistic as we’ve always maintained [since it doesn’t take into account “cancelled / re-listed” listings, many of which are included in “Newly Listings”] - as of month-end were 27,495. That’s up 22.4% YoY. At month-end February 2022 that total was 6,985, just for the record. Nearly 400% higher… on “almost” half the sales volume [9,097 / 5,211]
Average “Listing Days on Market” was 33 - meaning, effectively, homes took “about 14% longer to sell”. “Property Days on Market” was 49. That latter stat includes time on market where a home listing was terminated and then reactivated - BUT it does not include those if the new listing was with a different broker. Again - just for the record… and context - those Days on Market numbers were nine and eleven respectively in February ‘22.
“Forward Inventory” gives us an idea of how much inventory we have: How long would it take to sell all current listings given a constant rate of sales volume. Calculated by taking “Total Active Listings” and dividing by the month’s “Sales”. That works out to about five-and-one-quarter months. Over 22 weeks. That’s on the long side compared to historical standards. Apologies for the repeated reference to “‘22-02”, but the differences are stark… a hard correction… the average time to sell was “ .768 of a month - virtually unchanged YoY” [meaning versus Feb. ‘21]. About 3.3 weeks. On average.
Well, “We live in interesting times”, as the “quote” goes. Not gonna attribute that as it’s very much under debate as to who actually coined it. Regardless - forward we go … As always, thanks for coming by. Get outside & enjoy the weather!... and start the prep for the colder version…🌞😎❄️
Andrew for theBB.group and JustBungalows.com
#JustBungalows
#theBB.group
Questions? Comments? ...We'd ❤️ to hear from you: You can drop us a line here!...
Set Up Your Own Customized SmartSearch
What's your property worth today?
Browse GTA Bungalows by City / Region
Durham Region | Halton Region | Peel Region | Simcoe County |
Toronto by Boroughs | Toronto by Neighbourhoods | York Region
Browse "Beyond the GTA" Bungalows by City / Region
Brant & Brantford Township | Dufferin County | Grey County | Guelph & Wellington County | Haldimand County | Haliburton County | Hamilton [City] | Hastings County | Kawartha Lakes | Kitchener-Waterloo & Cambridge | Muskoka District | Niagara Region | Northumberland County | Parry Sound District | Peterborough City & County | Prince Edward County

