
SEE CHARTS BENEATH THE REFERENCE MAP FOR FULL APRIL 2025 BUNGALOW STATS BROKEN DOWN BY CITY/REGION:
- Total number of Bungalows Sold on the month
- Average, Median, Mode, Low & High:
- Asking Price
- Original Asking Price
- Sale Price
- % Listing-to-Selling Price Ratio
- Property Tax Amounts
- # of Bedrooms [Above grade level.]
- # of Bathrooms / Washrooms [Total - all levels.]
- # of Days on Market [DOM]
Get Complete Listing & Sold Info for Your Own Neighbourhood Here
See Archived Bungalow QuickStats Monthly Updates Here
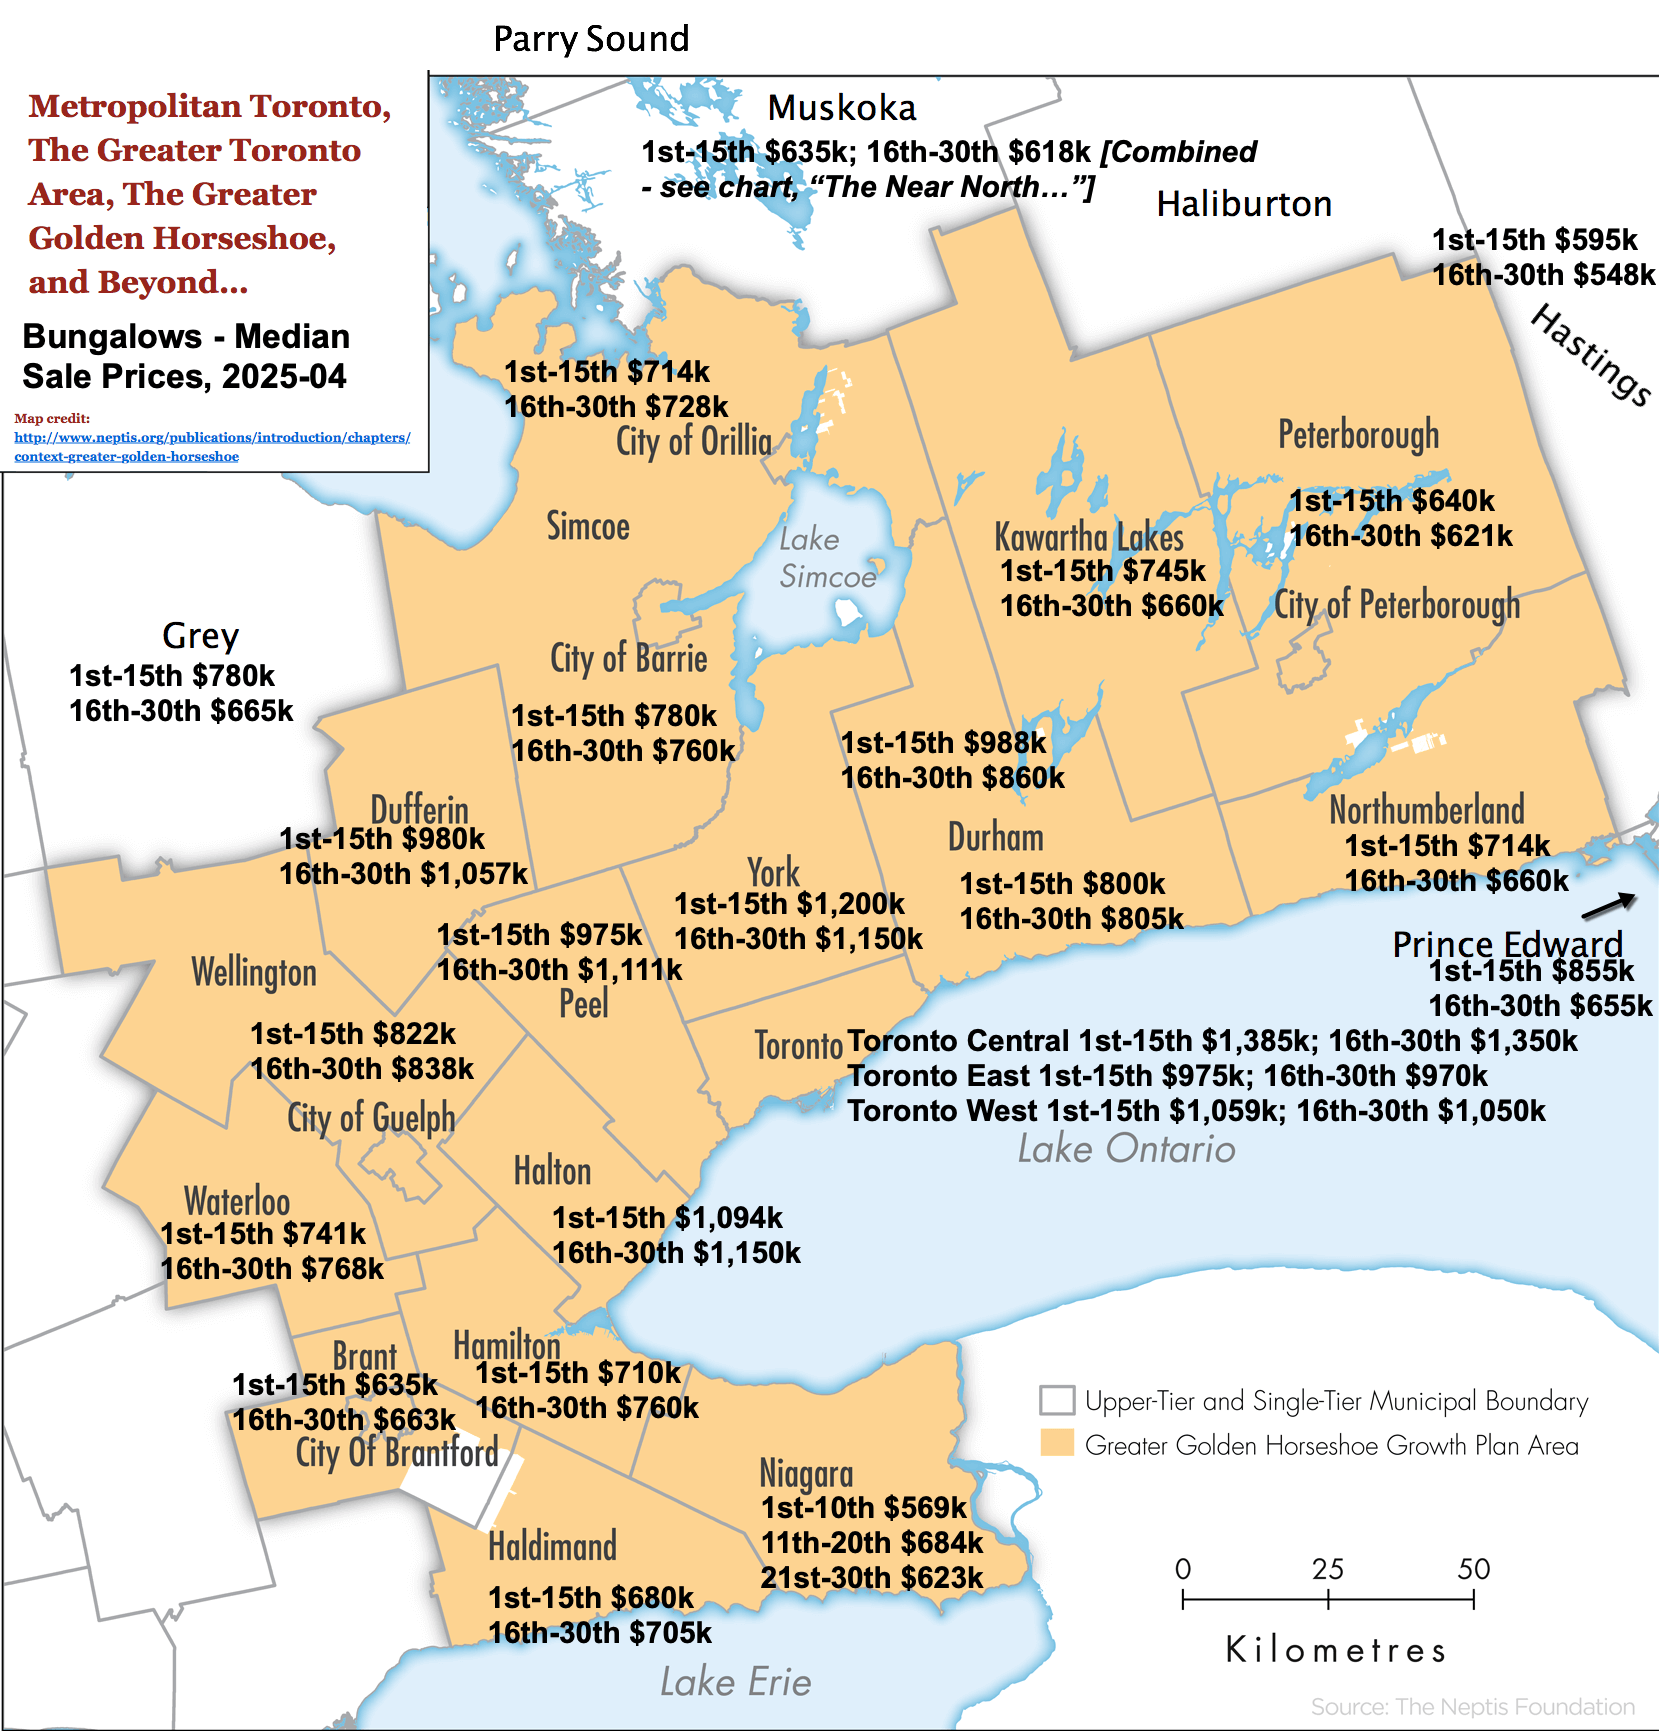
You'll notice that since the March, 2025 QuickStats update, the keymap shows Median Sale prices for the 1st & 2nd halves of the month separately in each City / Region. There are a couple of reasons for this:
- Given the volatility in the markets [and the politics, of course], we felt it might be interesting to see the stats divided this way.
- While mulling that option, we also discovered that a glitch in the data delivery from the TRREB MLS® System was going to force our hand anyway! Long story short, we had no choice. Niagara Region is - again - split into three segments because sales volume has been relatively high.
Browse GTA Bungalows by City / Region:
Durham Region | Halton Region | Peel Region | Simcoe County | Toronto by Boroughs | York Region
Browse "Beyond the GTA" Bungalows by City / Region:
Brant & Brantford Township | Dufferin County | Grey County | Guelph & Wellington County | Haldimand County | Haliburton County | Hamilton [City] | Hastings County | Kawartha Lakes | Kitchener-Waterloo & Cambridge | Muskoka District | Niagara Region | Northumberland County | Parry Sound District | Peterborough City & County | Prince Edward County
Notes:
Generally, because of the high volume of Bungalows for sale and sold during peak months & seasons, the following large, popular Cities, Regions & Counties are divided into north and south for statistical summary purposes:
Durham Region:
North [Brock, Scugog, Uxbridge]
South [Ajax, Clarington, Oshawa, Pickering, Whitby]Simcoe County:
North [Christian Island 30, Clearview, Collingwood, Midland, Orillia, Oro-Medonte, Penetanguishene, Rama First Nation 32, Ramara, Severn, Springwater, Tay, Tiny, & Wasaga Beach]
South [Adjala-Tosorontio, Barrie, Bradford / West Gwillimbury, Essa, Innisfil, & New Tecumseth]
With generally lower Bungalow market activity, particularly through the slower winter months, the following are combined and reported as one Area for statistical updates:
“The Near North”: Haliburton County, Muskoka District, & Parry Sound District
#JustBungalows #theBB.group #SOTM #SingleStoreyHome #1Storey
Note: Unofficial data. Copyright TRREB, theBB.group™ and JustBungalows.com™. TRREB MLS® data. Figures may be rounded; dates may be expanded as noted. GTA/GGH… map credit: neptis.org - Map Statistics represent the MEDIAN selling price of Freehold Bungalow Style homes reported as "Firm Sales" during the time frames indicated. Other Home Types & Styles [e.g. Condominium Bungalows, Freehold 1.5 Storey homes, etc.] are intentionally excluded from this data, though may be included depending on coding of MLS® listings. Year-over-year comparisons often reflect adjustments due to changing Board jurisdictional / data / MLS® coverage / boundaries. For more information, please contact us. E&OE.

