Toronto, Ontario, October 4, 2023 - “MarketWatch”, the monthly Toronto Regional Real Estate Board’s residential market statistical report was released by TRREB President Paul Baron. There are varying opinions on the “state of the housing market” - largely revolving around the word “crisis”. The frequent use of that word of late has been - for me - intensely reminiscent of the iconic Supertramp album cover, “Crisis? What Crisis?”
 © Supertramp; A&M Records
Many see the largest problem as lack of inventory… to the point where it became “necessary” to cut into The Greenbelt in order to find enough land to build enough homes. Others maintain the core problem is one of simpler but broader affordability issues. Supply & demand basics, of course, link those two issues inextricably. We’ve long been in the latter camp as affordability has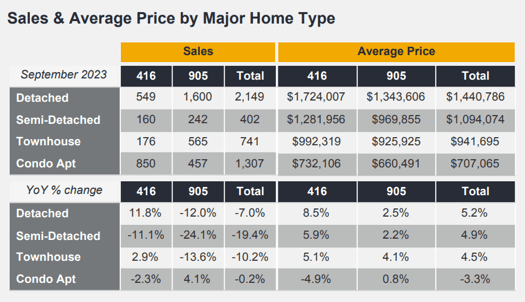 fueled “FOMO” - fear of missing out - and justifiably so. The question is, “Why?” Or, perhaps our theme here should be, “Crisis? Which Crisis?”
Rather than simply “inventory” - the number of available homes - affordability and FOMO have perhaps been impacted more by historically low interest rates than simply a lack of homes - that’s showing up now in the inventory numbers as interest rates have “normalized" - very quickly - creating a new twist to the crisis: Carrying costs for those with variable rate mortgages or mortgages that are now renewing. “Yikes”, for many. Crisis on both sides of the home ownership fence, in a sense.
We’re hearing more and more stories about financial stress in general, with one particular area of note being “Assignment Sales”. These occur when one party sells the “paper” to another… meaning an unclosed transaction. This isn’t new, but it’s frequency has 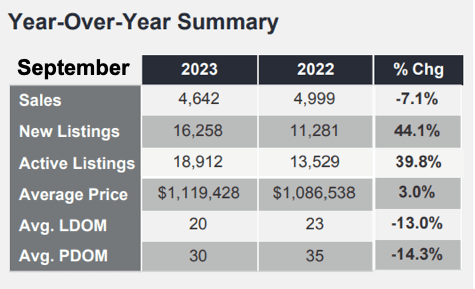 increased rapidly of late - first with Condos and later with Freehold [e.g. non-Condo Detached, Semi-Detached, Row or Town Homes etc.]. Here’s a specific example that was related to me last week: A buyer agrees to purchase a home in the ‘burbs east of Toronto - Durham Region. That was about eighteen months ago. The buyer’s deposit was two hundred thousand dollars. When that deposit was put down and the Agreement of Purchase and Sale signed between the buyer and the builder, the house wasn’t even started yet. Fast forward 18 months and, with interest rates considerably higher… plus prices in that particular community where the subject homestead now stood actually somewhat lower, the buyer could no longer afford the house.
Unfortunately, in this particular instance, the buyer waited too long to remedy the problem. Mere days before the transaction was scheduled to complete she tried to get out of the deal. No dice. No house. $200k deposit gone. What she should have done was sought advice sooner and listed the house for sale as an “assignment” - meaning just that: Sell the paperwork, essentially, thus assigning the Agreement to another party.
Housing crisis? Out-of-control demand? Greed?... “FOMO” among regular folks. Or just a simple desire to own their own bricks & mortgage… er… mortar… What gets missed often in the “crisis” discussion is the rise of the “business” buyer, let’s call them. Corporations in the business of buying residences to rent out, looking for both monthly income and capital appreciation. Even just regular peeps who have access to - through accumulated wealth or cobbled borrowing - enough capital to buy “doors”. Rental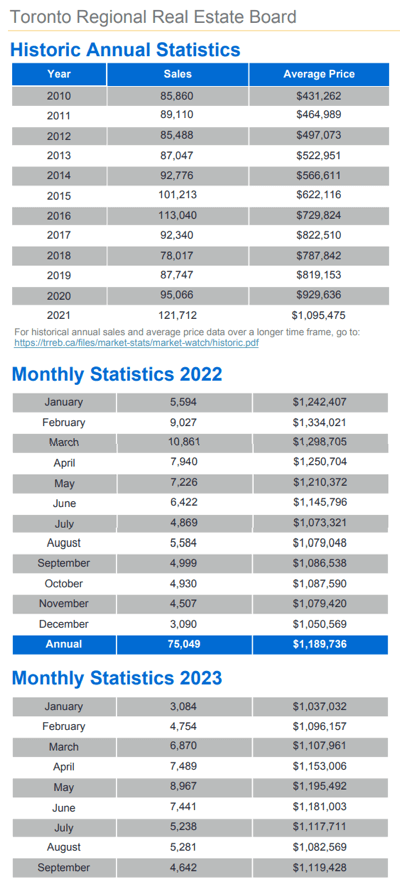 units. Homes. Between all those different types of buyers sucking up inventory and a market fuelled further by historically low interest rates is it any big surprise we’ve created a crisis?
BTW - that buyer described above? True story. And, given that actual household income came nowhere near enough to “qualify” to buy and finance the balance of the purchase price, it’s apparent that that was all about speculation. The intent from the outset to “flip the paper”. It’s been a lucrative game in recent years; arguably risky. And it appears the music has ended. Agree to buy a home not even started yet. Drop a down payment. Not even concerned about actual mortgage financing if you’re never going to close on the deal. You sell the deal paperwork to someone else - for a higher price than you paid, of course. Speculation. Arbitrage. Easy money. Just don’t forget to send the CRA their cut… or that’ll come back to haunt… [Oh, yeah - speaking of “haunt” and before I forget, Happy Hallowe’en! 🎃🧙]
Overall
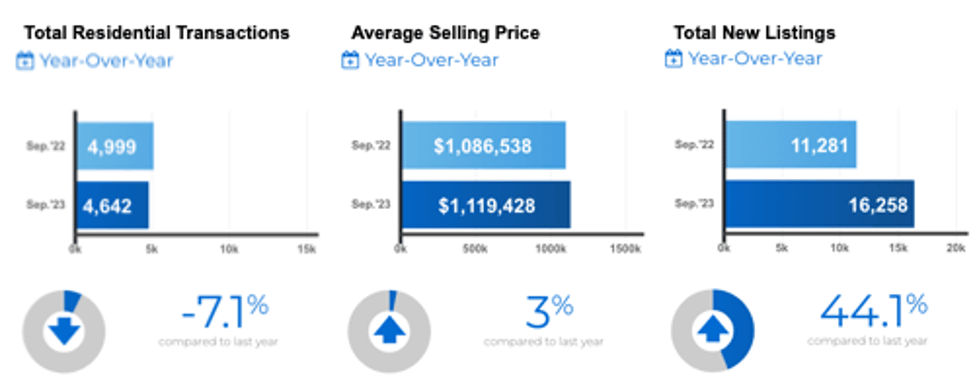
Including all home classes, types & styles across all of TRREB’s market area, 4,642 homes went under contract last month. That was 7.1% lower than last year. The overall average selling price for those sales came in at $1,119,428 which represented a 3% increase.
The sole positive numbers on the “sales volume” side of the report’s summary were in the “Toronto Detached Homes” group - up a surprising 11.8% - and for Condo Apartment sales in “The 905” area that surrounds Metro Toronto. The sole negative on the selling price side of the summary was for that same group - Condo Apartments - but in “The 416”: Metro T.O. proper. [For the uninitiated, “905” and “416” refer to the predominant telephone area codes for “Toronto and The GTA” - though more area codes have been added in recent years as population and phone use has grown rapidly. Pretty sure those labels & circumstances aren’t unique to South-Central Ontario.]
Specific Numbers by Home Type
Metropolitan Toronto had 549 sales of Detached homes reported, up 11.8%, at an average selling price of $1,724,007, up 8.5%. The balance of the Greater Toronto Area saw 1,600 “Detacheds” sell, off an even twelve percent, averaging $1,343,606, up 2.5%.
Sales volume in the Condo Apartment space was down 2.3% in Toronto at 850 units reported averaging a selling price of $732,106, down 4.9%. The balance of TRREB’s market area saw 457 sell, up 4.1%, at an average of $660,491, virtually flat YoY price-wise at + 0.8%.
We should note once again that all figures herein are year-over-year comparisons - due to the general strong seasonality of the residential real estate market - except where specifically noted otherwise.
Quoting from the Report:
Board President Paul Baron:
“The short and medium-term outlooks for the GTA housing market are very different. In the short term, the consensus view is that borrowing costs will remain elevated until mid-2024, after which they will start to trend lower. This suggests that we should start to see a marked uptick in demand for ownership housing in the second half of next year, as lower rates and record population growth spur an increase in buyers.”
Board Chief Market Analyst Jason Mercer:
“GTA home selling prices remain above the trough experienced early in the first quarter of 2023. However, we did experience more balanced market in the summer and early fall, with listings increasing noticeably relative to sales. This suggests that some buyers may benefit from more negotiating power, at least in the short term. This could help offset the impact of high borrowing costs.”
Board CEO John DiMichele:
“TRREB’s annual consumer polling has shown that half of intending home buyers in Toronto will be first-time buyers in any given year. The average price of a condo apartment in Toronto is over $700,000. Yet, the first-time buyer exemption threshold for the City’s upfront land transfer tax has remained at $400,000 for a decade-and-a-half. With this in mind, TRREB applauds Toronto City Council for asking City staff to provide a report on a more appropriate exemption level moving forward. Many housing and taxation policies are currently set in opposition and we need all levels of government to align policies and work together to solve this housing crisis.”
A Quick Look at Inventory
Arguably, the entire theme of this post is “Inventory” given that that’s a huge piece of the crisis “puzzle” so I’ll keep this brief: There were 16,258 homes newly listed on the month. That’s a 44.1% jump in inventory compared to twelve months earlier. So much for an inventory crisis.
We’ve always maintained that the more relevant figure is the Total Active Listings figure - more relevant because it inherently takes into account property listings canceled and re-written - and that came in at 18,912 as of month-end. That’s a 39.8% spike YoY. No matter which way you cut it, clearly inventory is not the problem at the moment.
“Forward Inventory” gives us a snapshot of where we are in terms of that supply : demand thing by simply showing how long it would take to sell all the homes currently listed for sale, assuming a constant rate of sales going forward. It’s calculated, simply, as “Total Active Listings” as of month-end divided by the month’s “Total Sales Volume”. At this point that comes to [18,912 / 4,642 =] slightly over four months of inventory. In the past several years we’ve been as low inventory-wise as two or three weeks. An epic seller’s market. That pendulum has most definitely swung back. This is now a buyer’s market no matter what anyone says. Historically, “forward inventory” in a balanced market runs around the 90 days mark.
As for prices, a colleague recently aptly put it thus: “In what world are prices not affected - either positively or negatively - by things like rising/falling supply or rising/falling carrying costs?” Immigration’s a common refrain in terms of who’ll support the market from the buying side. You think that just because someone just immigrated they have no clue where this market is in the bigger picture? These folks aren’t necessarily gonna step off the plane and buy a home! …just as an example; a thought.
Even those ever-popular Bungalows… one storey, easier maintenance, and a minimum of stairs… are sometimes shunned. Though I suppose a natural tendency of the human condition to “want more” can be blamed, at least in some instances: I just saw one where the listing - taken by a very “high profile” local Realtor® - was set up for “multiple offers”. Very nice home. Newly renovated. Basement apartment. Garage. Just twenty minutes to Pearson International Airport and 35 to watch the Maple Leafs play at ScotiaBank Arena. Priced very aggressively in the hope of generating a handful of offers… at least. Offer night? “Crickets”, as they say. Almost: One offer. No deal. Seller turned it down and immediately re-listed the property [note that “New Listings vs Total Active Listings” argument above!] …with the price jacked up just shy of 50%. Greed? Denial? A pause in the action? Time - as it usually does - will tell.
Homes sold - counter-intuitively to a degree - “13% faster” on the month at 20 listing days on the market [LDOM] versus 23. That’s the “pure” listing DOM number in that it looks only at the number of days the current listing was active before the home sold “firm”. The more recently added statistic is the “PDOM” which - to some degree - takes into account those “cancel & re-write the listing” scenarios alluded to above as well as listings that expire and are subsequently re-listed [haven’t seen many of those in a very long time… but that, of course, is changing - along with the more frequent incidences of “Price Change” lately]. It’s actually a more indicative number. It includes recent previous listings / cancellations / re-writes… for the property - but only where subsequent listings are with the same broker. If a Seller cancels or expires and then re-lists with a different agent / broker, those aren’t included in the “PDOM” numbers - just to be clear.
Enjoy the fall weather, colours…! 🍂🍁🦃🎃 And, as always, “We’d like to thank you very much for kindly dropping in”! ‘Til next time…
Andrew.
Questions? Comments? Drop us a line!…
Set Up Your Own Customized SmartSearch
What's your property worth today?
JustBungalows.com Home Page
Questions? Comments? ...We'd  to hear from you!
Browse GTA Bungalows by City / Region:
Durham Region | Halton Region | Peel Region | Simcoe County | Toronto by Boroughs | York Region
Browse "Beyond the GTA" Bungalows by City / Region:
Brant & Brantford Township | Dufferin County | Grey County | Guelph & Wellington County | Haldimand County | Haliburton County | Hamilton [City] | Hastings County | Kawartha Lakes | Kitchener-Waterloo & Cambridge | Muskoka District | Niagara Region | Northumberland County | Parry Sound District | Peterborough City & County | Prince Edward County

