Greater Toronto, Ontario, June 2, 2023 - “MarketWatch”, the Toronto Regional Real Estate Board’s monthly stats report, was put out this morning 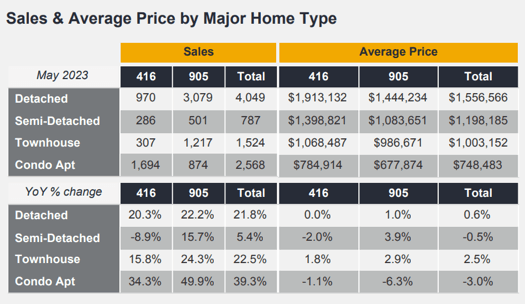 by Board president Paul Baron merely confirming the continued constrained inventory of available homes listed for sale as reflected in the statement, "...the supply of homes for sale did not keep up with the demand for ownership housing. Sales as a share of new listings were up dramatically...". In short, sales volume remained strong while inventory levels continued to lag versus the year-earlier period.
Talk of a continuation of the rise in interest - and therefore, of course, mortgage - rates likely helped pull some buyers off the sidelines and get into the market before the next rate hike. Rising rates, obviously, negatively impact buying power but with inventory still tight, prices remain “supported”… All figures quoted herein are year-over-year comparisons - because of the strong seasonality of the residential real estate market - unless specifically noted otherwise.
The Big Picture
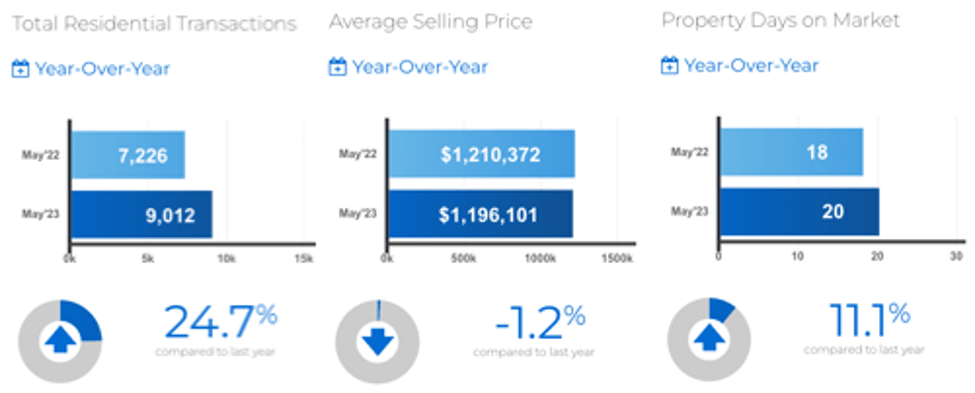
Overall - including all home types & styles across all of TRREB’s market area - GTA Realtors® through the Board’s MLS® system reported 9,012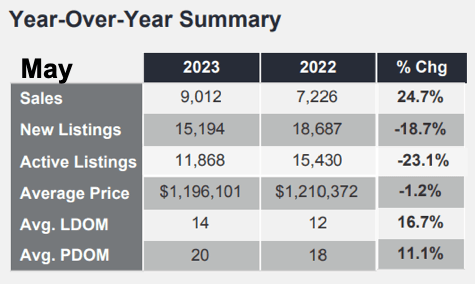 homes sold representing a 24.7 per cent increase in volume. That volume was also up by +5.2% compared to April, 2023. The overall average sale price came in at $1,196,101, relatively flat at -1.2%.
Specifics by Type of Home
Detached home sales volume reported in Metropolitan Toronto came in at 970 units, up 20.3%, at an average selling price of $1,913,132, virtually unchanged from last year. The balance of TRREB’s market area - “The 905” [area code] generally speaking - had 3,079 Detached sales reported, representing a 22.2% jump, averaging $1,444,234, up one lonely percentage point.
Condo Apartments enjoyed even stronger sales volume increases than that Detached group, though prices were a little softer: In Metro T.O., sales were up 34.3% to 1,694 units averaging $784,914 - down 1.1%. The rest of the market area had 874 sales of Condo Apartments reported, up 49.9%, at an average sell price of $677,874, off 6.3%.
That Inventory Thing
So “available homes for sale” has been a much debated issue for some time now. The powers that be want to bite into The Greenbelt to “solve the problem”. Others argue that that’s not the real issue. The latter argument might be supported by the month’s stats, namely…generally:
Sales volume is definitely up as outlined above.
Inventory continued downward relative to demand, with newly listed homes down 18.7% and [the more indicative] total available listings down 23.1%.
So why are prices “flat-to-lower”?
Markets don’t stay “flat”, generally speaking. At least, not for extended periods. As with anything else, they’re most often either in advance or decline mode. Could this be an indication that we’re back into a market shift to softer/slower as we saw through much of 2022? Or is this merely a “pause that refreshes”?
Many economists - professional and amateur alike - predicted more of a sustained correction in home prices in the face of massive debt combined with rising interest rates. The simple logic: Higher rates reduce buyers’ mortgage qualification amounts and, therefore, softer prices are inevitable. Further - and perhaps even more importantly - existing homeowners whose mortgages come up for renewal at significantly higher rates on very large mortgage principal balances would be forced to sell - a natural function of any “naturally functioning” market, be it homes, equities, bonds, or anything else. The result? Increasing inventory… and its “counter”, further softening prices. Supply v Demand.
But wait! That “natural function” wasn’t so natural after all. It seems many people weren’t even aware of something shiny and new: “The Mortgage Code of Conduct”. That included - as reported by Global News - “would direct financial institutions to provide Canadians struggling to make mortgage payments with “fair and equitable access to relief measures.” This could include adjusting payment schedules, extending amortizations on the loan…”.
That’s not insignificant - to say the least. The result, apparently for a lot of homeowners, is that monthly payments have remained constant but do not even cover the interest. This means the mortgage’s balance is actually rising as opposed to being paid down… and that means the amortization period is getting longer. A lot longer in some cases…like… over fifty years.
As BetterDwelling puts it, “Canadian Banks Are Extending Amortizations Over 35 Years To Avoid Defaults”. But it appears this has actually deteriorated to the point where there’s now talk of “multi-generational mortgages” where the kids and the grandkids take over the payments. Oh, what a tangled web we weave… And this in the face of already extreme levels of debt in Canada. And housing costs that have shot higher in recent years. Interest rates have been increasing, of course, because of rising inflation… combined with the risk presented by elevated overall debt loads.
Quickly, diving a little deeper on those inventory figures: Total Active Listings came in at 11,868 homes available for sale… Dividing by the month’s sales volume gives us an “Indicated Forward Inventory” of about 1.3 months of supply. That’s stubbornly low by historical standards…still. We shall see…
The “Absorption Rate” - sales volume divided by new listings - essentially an indicator of how quickly the market’s “absorbing” new listings as sales - came in at .593.
Quoting from the Report:
Jason Mercer, TRREB Chief Market Analyst: “The demand for ownership housing has picked up markedly in recent months. Many homebuyers have recalibrated their housing needs in the face of higher borrowing costs and are moving back into the market. In addition, strong rent growth and record population growth on the back of immigration has also supported increased home sales. The supply of listings hasn't kept up with sales, so we have seen upward pressure on selling prices during the spring.”
Paul Baron, Toronto Regional Real Estate Board (TRREB) President: “Despite the fact that we have seen positive policy direction over the last couple of years, governments have been failing on the housing supply front for some time. Recent polling from Ipsos found that City of Toronto residents gave Council a failing grade on housing affordability and pointed to lack of supply as the major issue. This issue is not unique to Toronto. It persists throughout the Greater Golden Horseshoe. If we don't quickly see housing supply catch up to population growth, the economic development of our region will be hampered as people and businesses look elsewhere to live and invest.”
And, Finally...
At just 14 days on the market [LDoM] versus 12 a year ago, homes were selling “16.7% slower” on the month. “PDoM”, “Property Days on Market”, which includes a property’s previous listing[s] by the same Agent, was 15 compared to 18 one year earlier. Both figures fall into the “very fast” time-to-sell category.
Thanks for stopping by… Get out and enjoy the weather!
Questions? Comments? Drop us a line anytime…
Set Up Your Own Customized SmartSearch
What's your property worth today?
JustBungalows.com Home Page
Questions? Comments? ...We'd  to hear from you!
Browse GTA Bungalows by City / Region:
Durham Region | Halton Region | Peel Region | Simcoe County | Toronto by Boroughs | York Region
Browse "Beyond the GTA" Bungalows by City / Region:
Brant & Brantford Township | Dufferin County | Grey County | Guelph & Wellington County | Haldimand County | Haliburton County | Hamilton [City] | Hastings County | Kawartha Lakes | Kitchener-Waterloo & Cambridge | Muskoka District | Niagara Region | Northumberland County | Parry Sound District | Peterborough City & County | Prince Edward County

