Greater Toronto, Ontario, Sept 6th, 2023 - The Toronto Regional Real Estate Board’s monthly stats update, MarketWatch, was released by TRREB President Paul Baron today and reflects moderately lower sales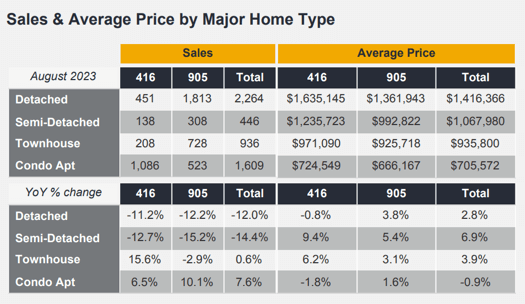 volume, increasing inventory, and generally flat prices across Metropolitan Toronto, the balance of the Greater Toronto Area, and the portions of South-Central Ontario’s Greater Golden Horseshoe that fall into TRREB’s market area.
The report tracks - generally - year-over-year residential market activity reported by Board member Realtors® via TRREB’s MLS® system. All figures herein are year-over-year comparisons unless otherwise noted.
Overall
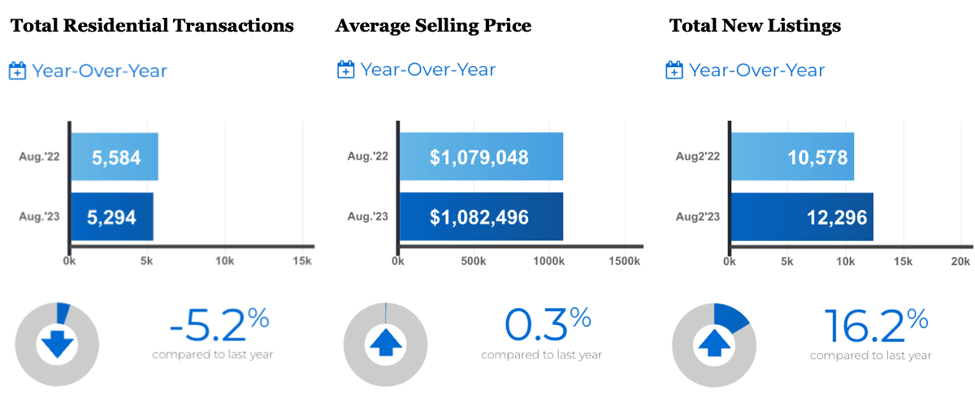
Total residential sales reported on the month were 5,294 representing a 5.2% decline compared to last August and includes all Classes, Types, & Styles of homes. “Classes” refers to, for example, Freehold as 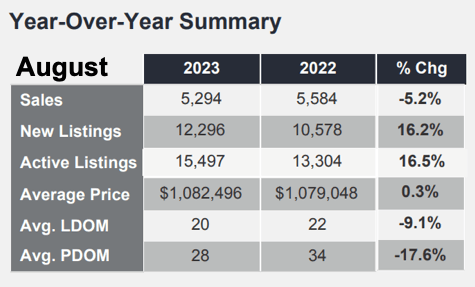 opposed to Condominium or other forms of home ownership. “Types” refers to the structure: Detached, Townhome, Apartment, etc. “Style” is the individual home’s “layout” - for lack of a better word - such as 2-Storey, Bungalow or 1-Storey, Backsplit, etc.
Sales volume was “mixed-to-lower” considering all classes/types/styles with the Freeholds generally lower [except for T.O. Townhouses] and Condos higher. As for average selling price, that was up across the board with the exceptions of Metro T.O. Detached homes and Condo Apartments - both of which registered small declines.
Specific Numbers by Home Type
Metro Toronto - “The 416” [area code] - saw 452 Detached homes sell, down 11.2%, at an average selling price of $1,635,145, relatively flat at -0.8%. The rest of the Board’s market area - “The 905" area code very generally speaking - saw 1,813 Detached sales reported 12.2%, averaging $1,361,943, up 3.8%.
Condominium Apartment sales were up across the area while prices stayed flat: In Metro Toronto 1,086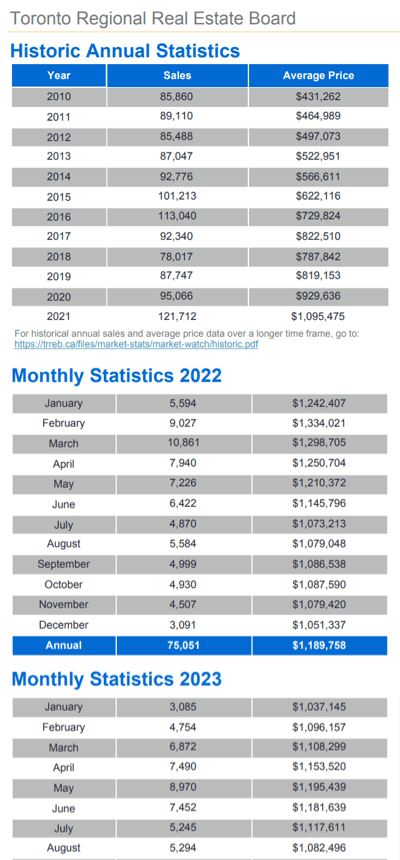 “Condos” traded, off 6.5%, averaging $724,549, off 1.8%.The rest of the Area saw 523 sales, up 10.1%, for an average $666,167, up 1.6%.
Quotable:
From the report…
TRREB President Paul Baron:
“Looking forward, we know there will be solid demand for housing – both ownership and rental – in the Greater Toronto Area and broader Greater Golden Horseshoe. Record immigration levels alone will assure this. In the short term, we will likely continue to see some volatility in terms of sales and home prices, as buyers and sellers wait for more certainty on the direction of borrowing costs and the overall economy.”
TRREB Chief Market Analyst Jason Mercer:
“More balanced market conditions this summer compared to the tighter spring market resulted in selling prices hovering at last year’s levels and dipping slightly compared to July. As interest rates continued to increase in May, after a pause in the winter and early spring, many buyers have had to adjust their offers in order to qualify for higher monthly payments. Not all sellers have chosen to take lower than expected selling prices, resulting in fewer sales.”
TRREB CEO John DiMichele:
“While higher interest rates have certainly impacted affordability, the prospect of higher taxes will also hit households’ balance sheets, especially younger buyers with limited savings. With the City of Toronto moving to raise the municipal land transfer tax (MLTT) rate on properties over $3 million as a revenue tool, it must also consider helping first-time home buyers struggling to enter the market by adjusting their tax rebate threshold to reflect today’s higher home prices.”
On the Inventory Front
Newly listed homes totalled 12,296 in August, a welcome 16.2% pop over last year’s total. “Total Active Listings”, which we’ve always maintained is the more relevant stat [because it takes into account none of the “cancel & re-list” listings, many of which are counted in the “Newly listed” figure] - was up a similar 16.5% to 15,497 homes available for sale. In a market which, like many others, has seen very tight inventory for a long time, this is a welcome turn - finally - particularly for those on the buyer side of the equation, obviously. Bigger picture it’s just plain healthy as the run-up in home prices and the extremely limited inventory situation were not sustainable.
What’s a little surprising is that, even in the face of rising inventory and, let’s say “stubborn” prices, homes still sold “9.1% faster” versis the year-earlier period at 20 Days on Market on average compared to 22… continuing “PDQ” - pretty darned quick - by historical standards.
“Forward Inventory” - Active Listings divided by the month’s Sales Volume - gives us the market’s pulse in terms of how long it’ll take to sell all the homes currently listed. That stood at 2.93 months which is far more in line with historical norms. Last August we were at 2.36 months. In August of 2021 the stats blog by-line here was “Inventory levels on life support”. At that point there were 8,201 Total Active Listings… and there were 8,596 sales that month. Yeah… that translated to a supply of inventory of less than a month - a situation that was by no means unique to that particular month in the context of the past several years. Or any other time, for that matter.
Regardless of the "bigger picture" inventory situation, Bungalows across Metro Toronto and the GTA continue to be in high demand - particularly in the more mainstream price ranges.
So - the big question: How far does this “pendulum” go? Will buyers sit on their hands and wait to see if prices soften before committing to a purchase? A big piece of the answer to that question lies with interest rates. Keep an eye on the Canadian 5-year bond yield chart for clues there: That’s the basis for mortgage rates [which is why bond yields are posted under “interest rates” on the Bank of Canada website]. Another piece of the puzzle is another simple question… Is the market simply exhausted with many “average peeps” simply being unable to afford even “the average home”?
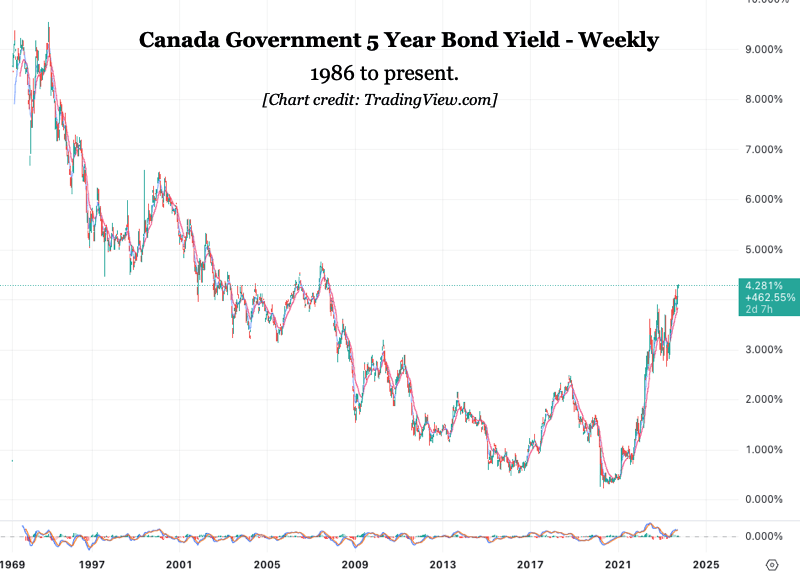
Bye the way: On that interest rate front, bear in mind that that 5-year bond yield hit an all-time low of 0.276% during the COVID-19 pandemic. March, 2020. You probably remember that! The all-time high was 18.78%. September, 1981. You may or may not remember THAT.
Stay tuned… As always, thanks for stopping by. Get outside and enjoy the weather!😎
Questions? Comments? Drop us a line!…
Set Up Your Own Customized SmartSearch
What's your property worth today?
JustBungalows.com Home Page
Questions? Comments? ...We'd  to hear from you!
Browse GTA Bungalows by City / Region:
Durham Region | Halton Region | Peel Region | Simcoe County | Toronto by Boroughs | York Region
Browse "Beyond the GTA" Bungalows by City / Region:
Brant & Brantford Township | Dufferin County | Grey County | Guelph & Wellington County | Haldimand County | Haliburton County | Hamilton [City] | Hastings County | Kawartha Lakes | Kitchener-Waterloo & Cambridge | Muskoka District | Niagara Region | Northumberland County | Parry Sound District | Peterborough City & County | Prince Edward County

